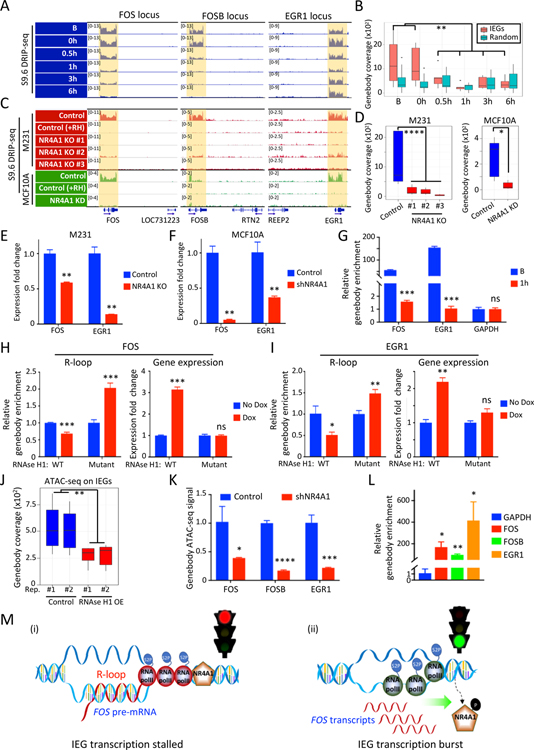
Figure 4. NR4A1-dependent R-loops and transcriptional elongation arrest at IEG genebodies.
(A) IGV tracks show S9.6 DRIP-seq signals from DNA:RNA hybrids (R-loops) across the genebody of IEGs (FOS, FOSB, EGR1) in M231 under serum replete conditions (B), and their time-dependent resolution upon 24 hour serum starvation (0h) and serum replenishment (0.5, 1, 3, 6h). For each IEG, the neighboring gene shows no R-loops, confirming gene-specific signal. (B) Quantitation of R-loops signal at IEG genebodies (FOS, FOSB, EGR1, JUN, JUNB and JUND) upon serum stress, compared with the same analysis for 6 randomly selected genebodies. (C) IGV tracks show loss of the S9.6 DRIP-seq signal across three IEG loci in three different CRISPR NR4A1-KO M231 clones, versus control, all cultured under serum-replete conditions (red). Specificity of R-loop signal is demonstrated by its disappearance upon in vitro RNaseH1 treatment (+RH). S9.6 DRIP-seq is also shown for MCF10A (green) following NR4A1-KD, compared with parental cells, again with RNase H1 treatment of parental cell lysates to confirm specificity (+RH). The neighboring gene within each IEG locus shows no R-loop signal. (D) Quantitative analysis of R-loop signal reduction at 6 IEG genebodies in 3 NR4A1-KO M231 clones and in MCF10A after NR4A1-KD. (E-F) Reduction in chromatin-associated FOS and EGR1 pre-mRNAs in NR4A1-KO M231, compared with parental controls (panel E) and in MCF10A with NR4A1-KD (panel F). Error bar, SD. (G) Sequential ChIP immunoprecipitations of NR4A1, followed by S9.6, demonstrates colocalization of NR4A1 and R-loops across the same locus in serum-replete MCF10A (B), but not upon serum replenishment (1h). ChIP-qPCR quantitation across genebodies of two IEGs (FOS, EGR1). GAPDH: non-IEG control. Error bar, SD. (H-I) Quantitation of R-loops (S9.6 DRIP-qPCR) and mRNA expression (qPCR) at IEGs FOS (panel H) and EGR1 (panel I), following Dox-inducible in vivo expression of wild-type (WT) RNase H1, versus an inactive RNase H1 mutant. Error bar, SD. (J) Reduction of chromatin accessibility (ATAC-seq) at 6 IEG genebodies upon ectopic inducible expression in MCF10A of RNase H1 (OE), versus uninduced control (K) Reduced chromatin accessibility at IEG genebodies (FOS, FOSB, EGR1) upon NR4A1-KD in MCF10A under basal conditions. Error bar, SD. (L) S9.6 DRIP-qPCR assay shows enrichment of R-loop signal at IEG genebody regions (FOS, FOSB, EGR1) in BRx82 metastases, compared with a control genebody locus (GAPDH). Error bar, SD. (M) Schematic model for NR4A1-mediated regulation of IEG expression: (i) Under unstressed conditions, NR4A1 restrains RNA Pol II transcriptional elongation across the IEG genebody, retaining pre-mRNA transcripts, generating R-loops and halting gene expression; (ii) Acute replication stress-induced phosphorylation of NR4A1 leads to its dissociation from the IEG genebody, releasing transcriptional elongation by RNA Pol II, resolving R-loops and triggering an acute burst of IEG expression from the rapid completion of poised pre-mRNA transcripts. In panels B, D-L, *P<0.05, **P<0.01, ***P<0.001, ****P<0.0001, ns, not significant, by two-tailed Student’s t-Test.

