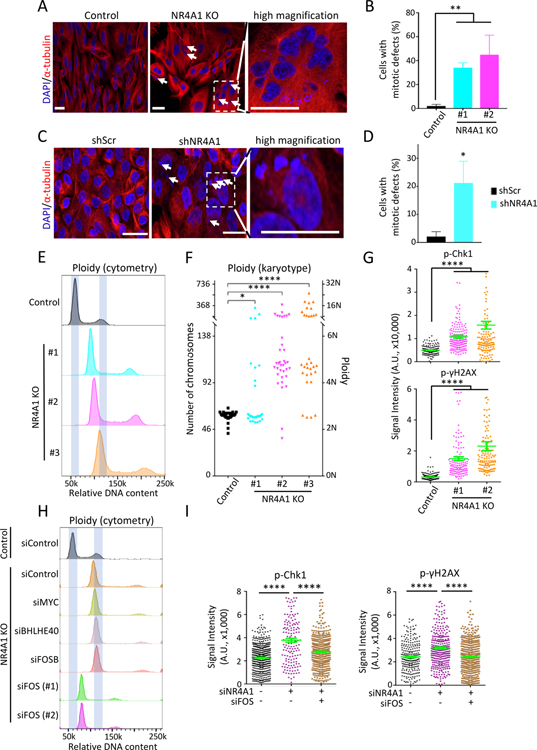
Figure 5. NR4A1 deletion triggers FOS-mediated replication stress and genomic instability.
(A) Representative images of dual α-tubulin and nuclear (DAPI) staining, shows increase of multinucleated cells and multinuclei in NR4A1-null M231 (arrows). Right inset, high magnification. Scalebar, 50 μM. (B) Quantitation of cells with gross mitotic defects in two M231 NR4A1-null clones, compared with parental control. Error bar, SD. (C) α-tubulin and DAPI staining shows multiple micronuclei (arrows) in NR4A1-KD MCF10A versus scrambled control (shScr). Scalebar, 50 μM. (D) Quantitation of NR4A1-KD MCF10A with mitotic defects. Error bar, SD. (E) Increased DNA ploidy (flow cytometry) in three independent NR4A1-null M231 clones, compared with controls. X-axis: relative DNA content (PI stain). (F) Single-cell karyotyping shows chromosome gain in three NR4A1-null M231 clones, compared with controls. (G) Quantitation of cells positive for phospho-Chk1 and phospho-γH2AX foci in two NR4A1-null M231 clones, versus parental cells. Error bar, SEM. (H) Resolution of aneuploidy (flow cytometry) in NR4A1-null M231, following suppression of FOS by siRNA (technical replicates: #1–2) versus siRNA control. No such rescue following knockdown of IEGs MYC, BHLHE40 or FOSB. X-axis: relative DNA content. (I) Reduction in phospho-Chk1 and phospho-γH2AX foci in M231 upon simultaneous siRNA knockdown of NR4A1 and FOS. Error bar, SEM. In panels G and I, image quantification was carried out by ImageJ. In panels B, D, F, G and I, *P<0.05, **P<0.01, ****P<0.0001, by two-tailed Student’s t-Test.

