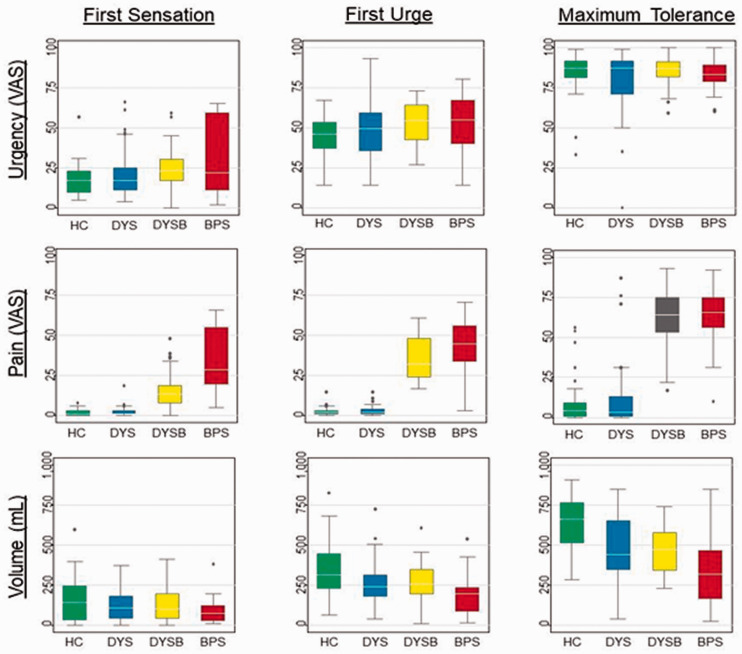
Figure 1.
Bladder urgency, pain, and volume measurements across the groups at cystometric thresholds. Box and whisker plots show median, 25th–75th percentiles, range, and outliers. HC = Healthy Control; DYS = Dysmenorrhea only; DYSB = Dysmenorrhea with Bladder Sensitivity; BPS = Bladder Pain Syndrome.

