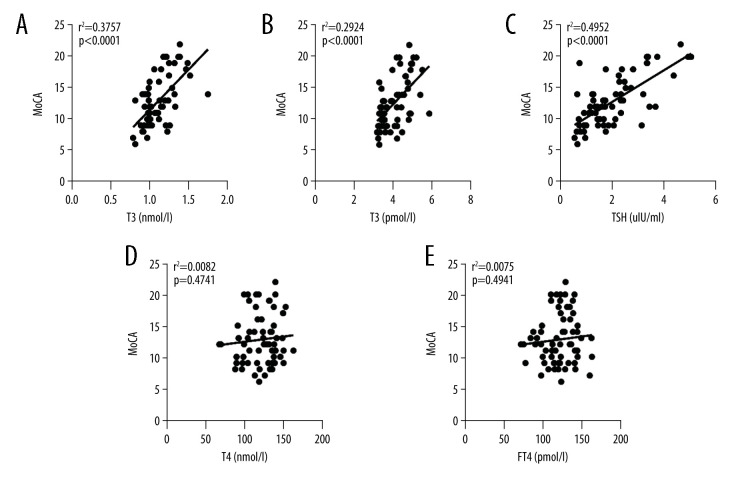
Figure 1.
Scatter plots of serum T3, FT3, TSH, T4, and FT4 levels against MoCA score: (A) Serum triiodothyronine (T3) against MoCA score. (B) Free triiodothyronine (FT3) against MoCA score. (C) Thyroid stimulating hormone (TSH) against MoCA score. (D) Serum thyroxine (T4) against MoCA score. (E) Free thyroxine (FT4) against MoCA score. r2 stands for coefficient of determination, P stands for P value.

