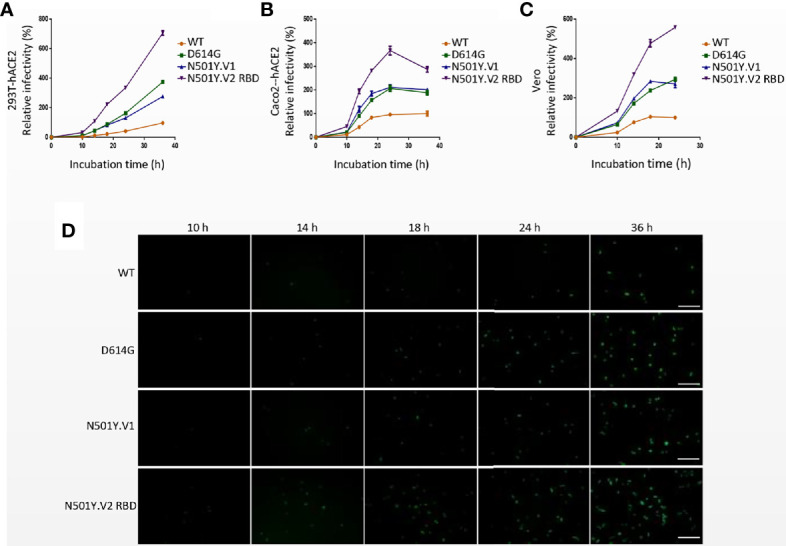
Figure 3.

Infection efficiency of SARS-CoV-2 variants N501Y.V1 and N501Y.V2 RBD in target cells at different time points. (A–C) Infectivity analysis of SARS-CoV-2 WT, D614G, N501Y.V1 and N501Y.V2 RBD entry into 293T-hACE2 (A), Caco2-hACE2 (B), and Vero (C) cells at 10 h, 14 h, 18 h, 24 h, and 36 h. Transduction efficiency was analyzed by luciferase activity in cell lysates. The infection efficiency of viruses was calculated by dividing the RLU values at each time point by the average SARS-CoV-2 WT RLU values at 36h. Experiments were done in 4 replicates and repeated at least twice. One representative is shown with error bars indicating SEM. (D) Representative images of SARS-Cov-2 WT, D614G, N501Y.V1 and N501Y.V2 RBD entry into 293T-hACE2 cells at indicated time points. The scale bar indicates 200 µm.
