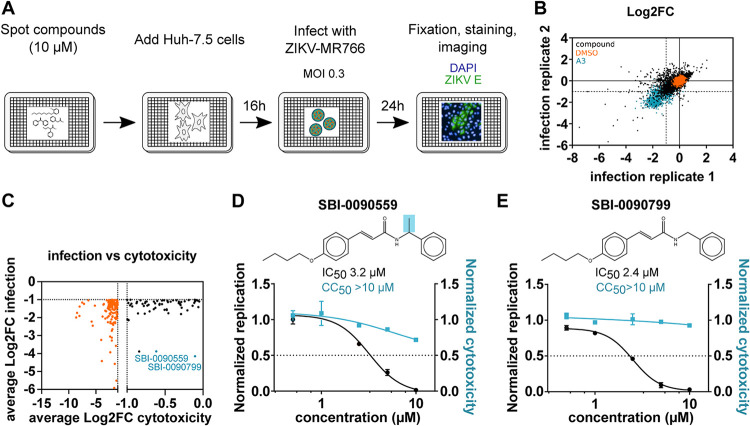
FIG 1.
Identification of SBI-0090799 as inhibitor of ZIKV infection through a high-throughput small chemical compound screen. (A) Schematic of the screening strategy used for the identification of chemical compounds showing antiviral activity directed against ZIKV. Huh-7.5 cells were pretreated for 16 h with the compounds (10 μM final concentration) and then infected with ZIKV MR766 (MOI, 0.3). Twenty-four hours after infection, cells were fixed and analyzed by immunofluorescence imaging. For each condition, the percentage of infection was calculated as the ratio of the number of infected cells stained for ZIKV envelope protein to the number of cells stained with DAPI. (B) Correlation plot indicating the log2 fold change (Log2FC) of each compound in the two replicate screens, after normalization to the median of each plate for ZIKV percentage of infection, across all screening plates (black dots). Values corresponding to DMSO (orange dots)- and A3 (cyan dots)-treated wells are also represented. (C) Dot plot indicating the average log2 fold change (Log2FC) of each compound in the two replicate screens, after normalization to the median of each plate, for cell count (cytotox, x axis) versus ZIKV percent infection (infection, y axis) for compounds reaching the criteria of selection of at least 50% inhibition of infection and less than 50% decrease in cell count (black dots). Compounds not meeting the cytotoxicity criteria are indicated by orange dots. The top 2 compounds selected for follow-up studies are indicated in cyan. (D and E) Huh-7.5 cells were pretreated for 16 h with increasing concentrations of SBI-0090559 (D) or SBI-0090799 (E) and then infected with ZIKV MR766 at an MOI of 0.3. Twenty-four hours after infection, cells were fixed and analyzed by immunofluorescence imaging. For each condition, the percentage of infection was calculated as described for panel A. Dose-response curves for infectivity (black) and cell number (cyan) are shown. Data are normalized to the mean for DMSO-treated wells and represent means ± SEM from n = 3 independent experiments. IC50 and CC50 for each compound were calculated using a four-parameter logistic nonlinear regression model and are indicated. Highlighted in blue is the structural difference between compound SBI-0090559 and SBI-0090799.

