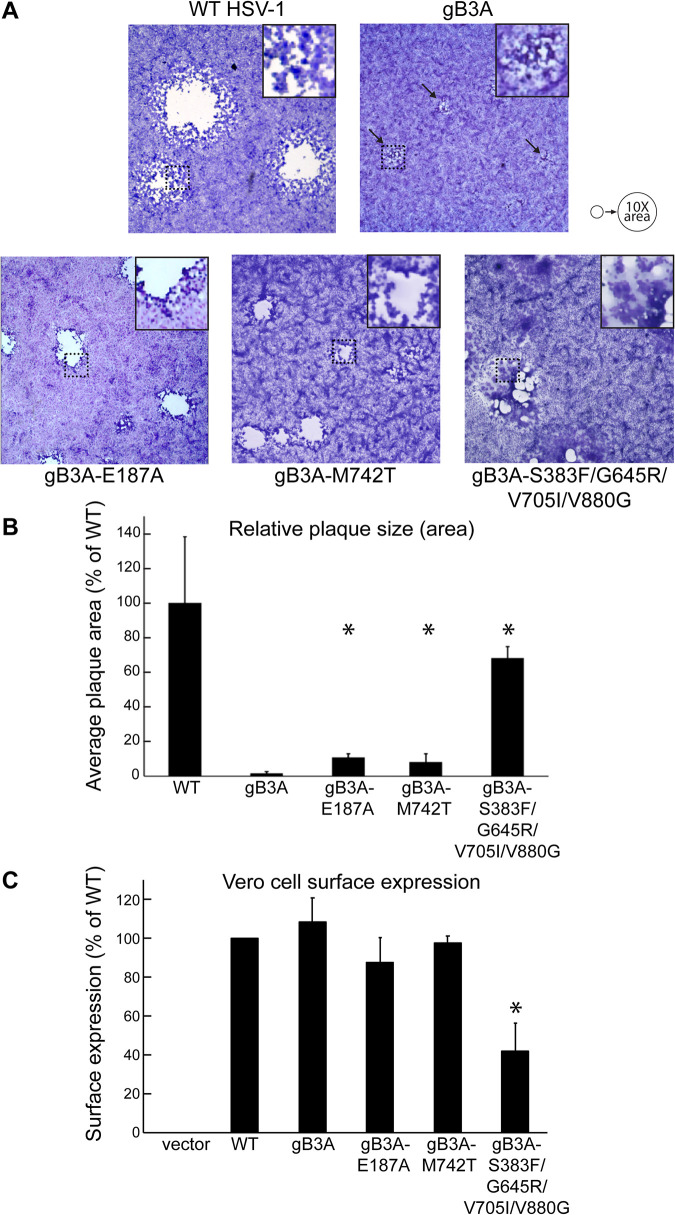
FIG 2.
Revertant virus plaques. (A) Plaque morphology. Vero cells were infected with BAC-derived WT HSV-1 (GS3217), gB3A virus, or gB3A revertant viruses at an MOI of 0.01. Three days after infection, cells were stained, and plaques were imaged at a ×40 total magnification. Arrows indicate small plaques formed by gB3A virus. Squares outlined by dotted lines were magnified and are shown as insets at the top right of each panel to highlight the syncytial plaque phenotype of gB3A-S383F/G645R/V705I/V880G revertant virus. The circles at the top right serve as a reference to show a 10-fold increase in the average plaque area. (B) Plaque size. Vero cells were infected as described above for panel A. The diameters of at least 50 randomly selected plaques from each virus were measured using Evos cell imaging. The average plaque area was calculated and expressed as a percentage of the WT HSV-1 plaque area. The error bars represent standard deviations. Asterisks indicate that the difference in plaque sizes between the mutant and gB3A viruses was statistically significant (Mann-Whitney U test). (C) Cell surface expression. Revertant virus gB genes were cloned into an expression construct with an N-terminal FLAG tag. The expression of gB on the surface of Vero cells was detected by a CELISA using anti-gB MAb II-105. The averages from three experiments are shown, and the error bars represent standard deviations. Asterisks indicate that the difference in expression between one mutant and WT gB was statistically significant (P < 0.05 using a t test).

