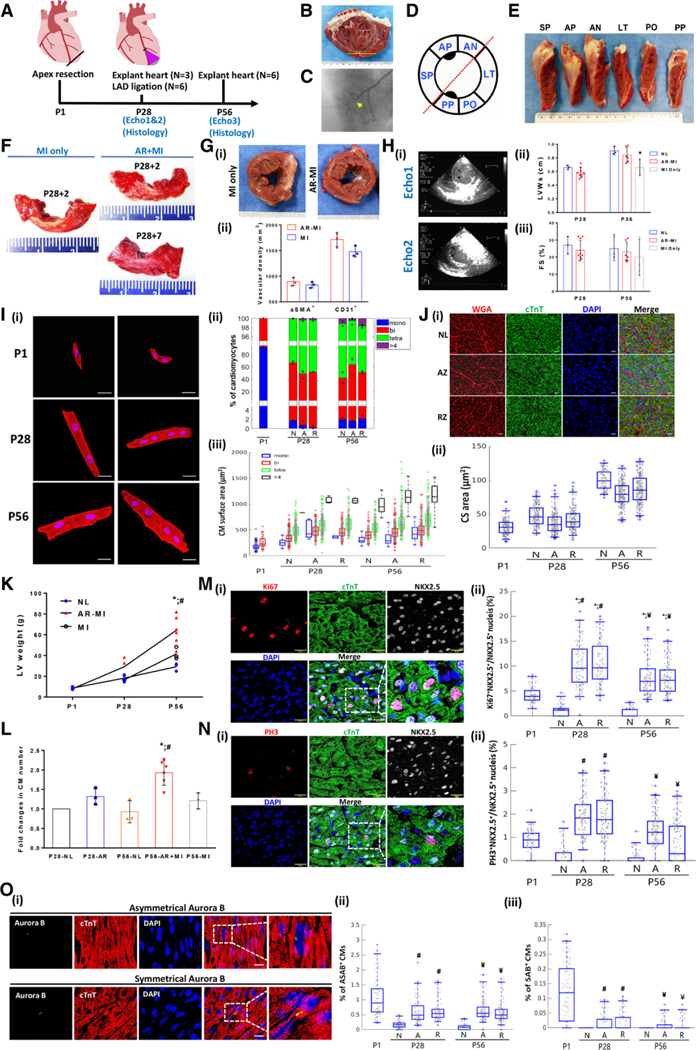
Figure. Myocardial remuscularization occurs after LAD ligation in 28 piglet received apical resection at P1.
A, Schematic overview of the experimental design. Echos1and 2 are echocardiograms taken before and after left anterior descending coronary artery (LAD) ligation distal to the second diagonal branch at postnatal day (P) 28. B, Typical images of the left ventricular (LV) internal view of the LV anterior wall of an apex resection with myocardial infarction (AR-MI) heart at P56. Yellow line indicates the location of the initial P1 apical resection. C, Coronary angiogram obtained at P56 to confirm the successful P28 LAD occlusion. D, Schematic diagram of the LV short-axis view subdivided into 6 circumferential segments according to coronary perfusion/ physiology. E, Typical longitudinal view of the LV at P56 of an AR-MI heart. No evidence of infarct in segments of the septal wall (SP), anterior wall with papillary muscle (AP), and anterior wall (AN) that are perfused by the LAD. F, Typical images of triphenyl tetrazolium chloride–stained LV anterior circumferential segments from the P28 control group of MI only 2 days after LAD ligation (left). AR-MI hearts were explanted 2 (right top) and 7 (right bottom) days after LAD ligation (ie, on P30 or P35); the normal myocardium is red, and the infarct appears white. Gi, Typical images of short-axis LV cross-sections from MI-only hearts (ie, LAD ligation on P28 without previous AR; left) and AR-MI hearts (ie, AR on P1 with LAD ligation on P28; right) that were explanted 28 days after LAD ligation (ie, on P56). Evidence of infarction (ie, white scar) is visible in the section from the MI-only heart but not in the section from the AR-MI heart. Gii, Quantification of myocardial vascular density by α-smooth muscle actin (aSMA) and CD31 staining for MI-only control hearts and AR-MI hearts. Hi, Typical echocardiographic images of an AR-MI heart obtained before (Echo1) and after (Echo2) LAD ligation at P28. Arrows in echo 2 identify anterior-septal systolic bulging secondary to LAD ligation. Hii and Hiii, Compiled echocardiographic data for age-matched normal, AR+MI, and MI-only hearts. *P<0.05 vs normal. Ii, Typical images of disaggregated cardiomyocytes (CMs) stained for cardiac troponin T (red); nuclei were counterstained with DAPI (blue). Bar=20 μm. Iii, Proportion of CMs containing 1 (mono), 2 (bi), 4 (tetra), or >4 nuclei at the indicated time points. Iiii, Quantification of the surface areas of disaggregated CMs (3 hearts per group, 300–500 CMs per heart). At least 1000 CMs were evaluated for each group at each time point. Ji, Typical images of myocyte cross-sectional (CS) area from different areas of the LV at P28. Scale bar=10 μm. Jii, Quantification of CS area over time (P1–P56). A minimal of 200 CMs from each group were counted. K, LV weight in normal, MI only, and AR-MI hearts over time of neonatal hearts (P1–P56). L, Relative changes of total CM counts in each group (normalized to P28 normal heart counts, ie, 4.318×10⁸). *P<0.05 vs P56 normal; #P<0.05 vs P56 MI only. To decipher whether the apical resection was accompanied by an increase in myocyte proliferation, we compared myocardial expression of karyokinesis markers of Ki67, PH3, and the M-phase nuclei division marker Aurora B (AB) in control and AR-MI hearts. M and O, When localized symmetrically between 2 daughter nuclei (symmetrical AB [SAB]), SAB staining is a marker for cytokinesis, whereas asymmetrical localization (asymmetrical AB [ASAB]) identifies a karyokinesis event within a single cell.5 Karyokinesis activity was expressed as percentage of Ki67+NKX2.5+ and PH3+NKX2.5+ nuclei over the total NKX2.5+ nuclei (M and N). The karyokinesis activity increased >10 fold at both P28 and P56 time points compared with postnatal age–matched normal in AR hearts (M and N). Each of the karyokinesis activity markers is similar to or higher than P1 normal hearts (M and N). The karyokinesis/cytokinesis activity was also measured as the percentage of CMs positively expressing ASAB (Oii) and SAB (Oiii) over the total number of cardiomyocytes (O). Again, the karyokinesis/cytokinesis activity as indicated by the percentage of positive ASAB (Oi and Oii) and SAB (Oiii) at P28 and P56 was a few folds higher than the age-matched normal (O) and similar to P1 normal hearts (O). At both P28 and P56 time points, the karyokinesis/cytokinesis activity was not significantly different between the AR cutting zone (A) and remote zone (R), indicating that the activation of myocyte proliferation machinery is expanded beyond the LV AR injury site (M through O). In normal hearts, the proportion of cardiomyocytes displaying Ki67, PH3, and AB expression declined to nearly undetectable levels on P28 and P56 (M through O), which is consistent with the cell cycle arrest (M through O). *P<0.05 vs P1. #P<0.05 vs P28 normal. ¥P<0.05 vs P56 normal. Significance was evaluated with1-way ANOVA when comparing >2 groups and 2-way ANOVA in K. For data displayed in boxplots (I, J, M, and O), significance was evaluated with the Mann-Whitney U test; the 3 lines represent the 25th, 50th (median), and 75th percentiles, and the vertical lines extend from the 5th to the 95th percentile. Values below the 5th percentile or above the 95th percentile were considered outliers. A or AZ indicates apex zone of the AR heart; FS, fractional shortening; LT, lateral wall; LVWs, left ventricular wall thickness during systole; N or NL, normal heart; PO, posterior wall; PP, posterior papillary wall; R or RZ, remote (basal) zone of AR-MI heart; and WGA, wheat germ agglutinin.

