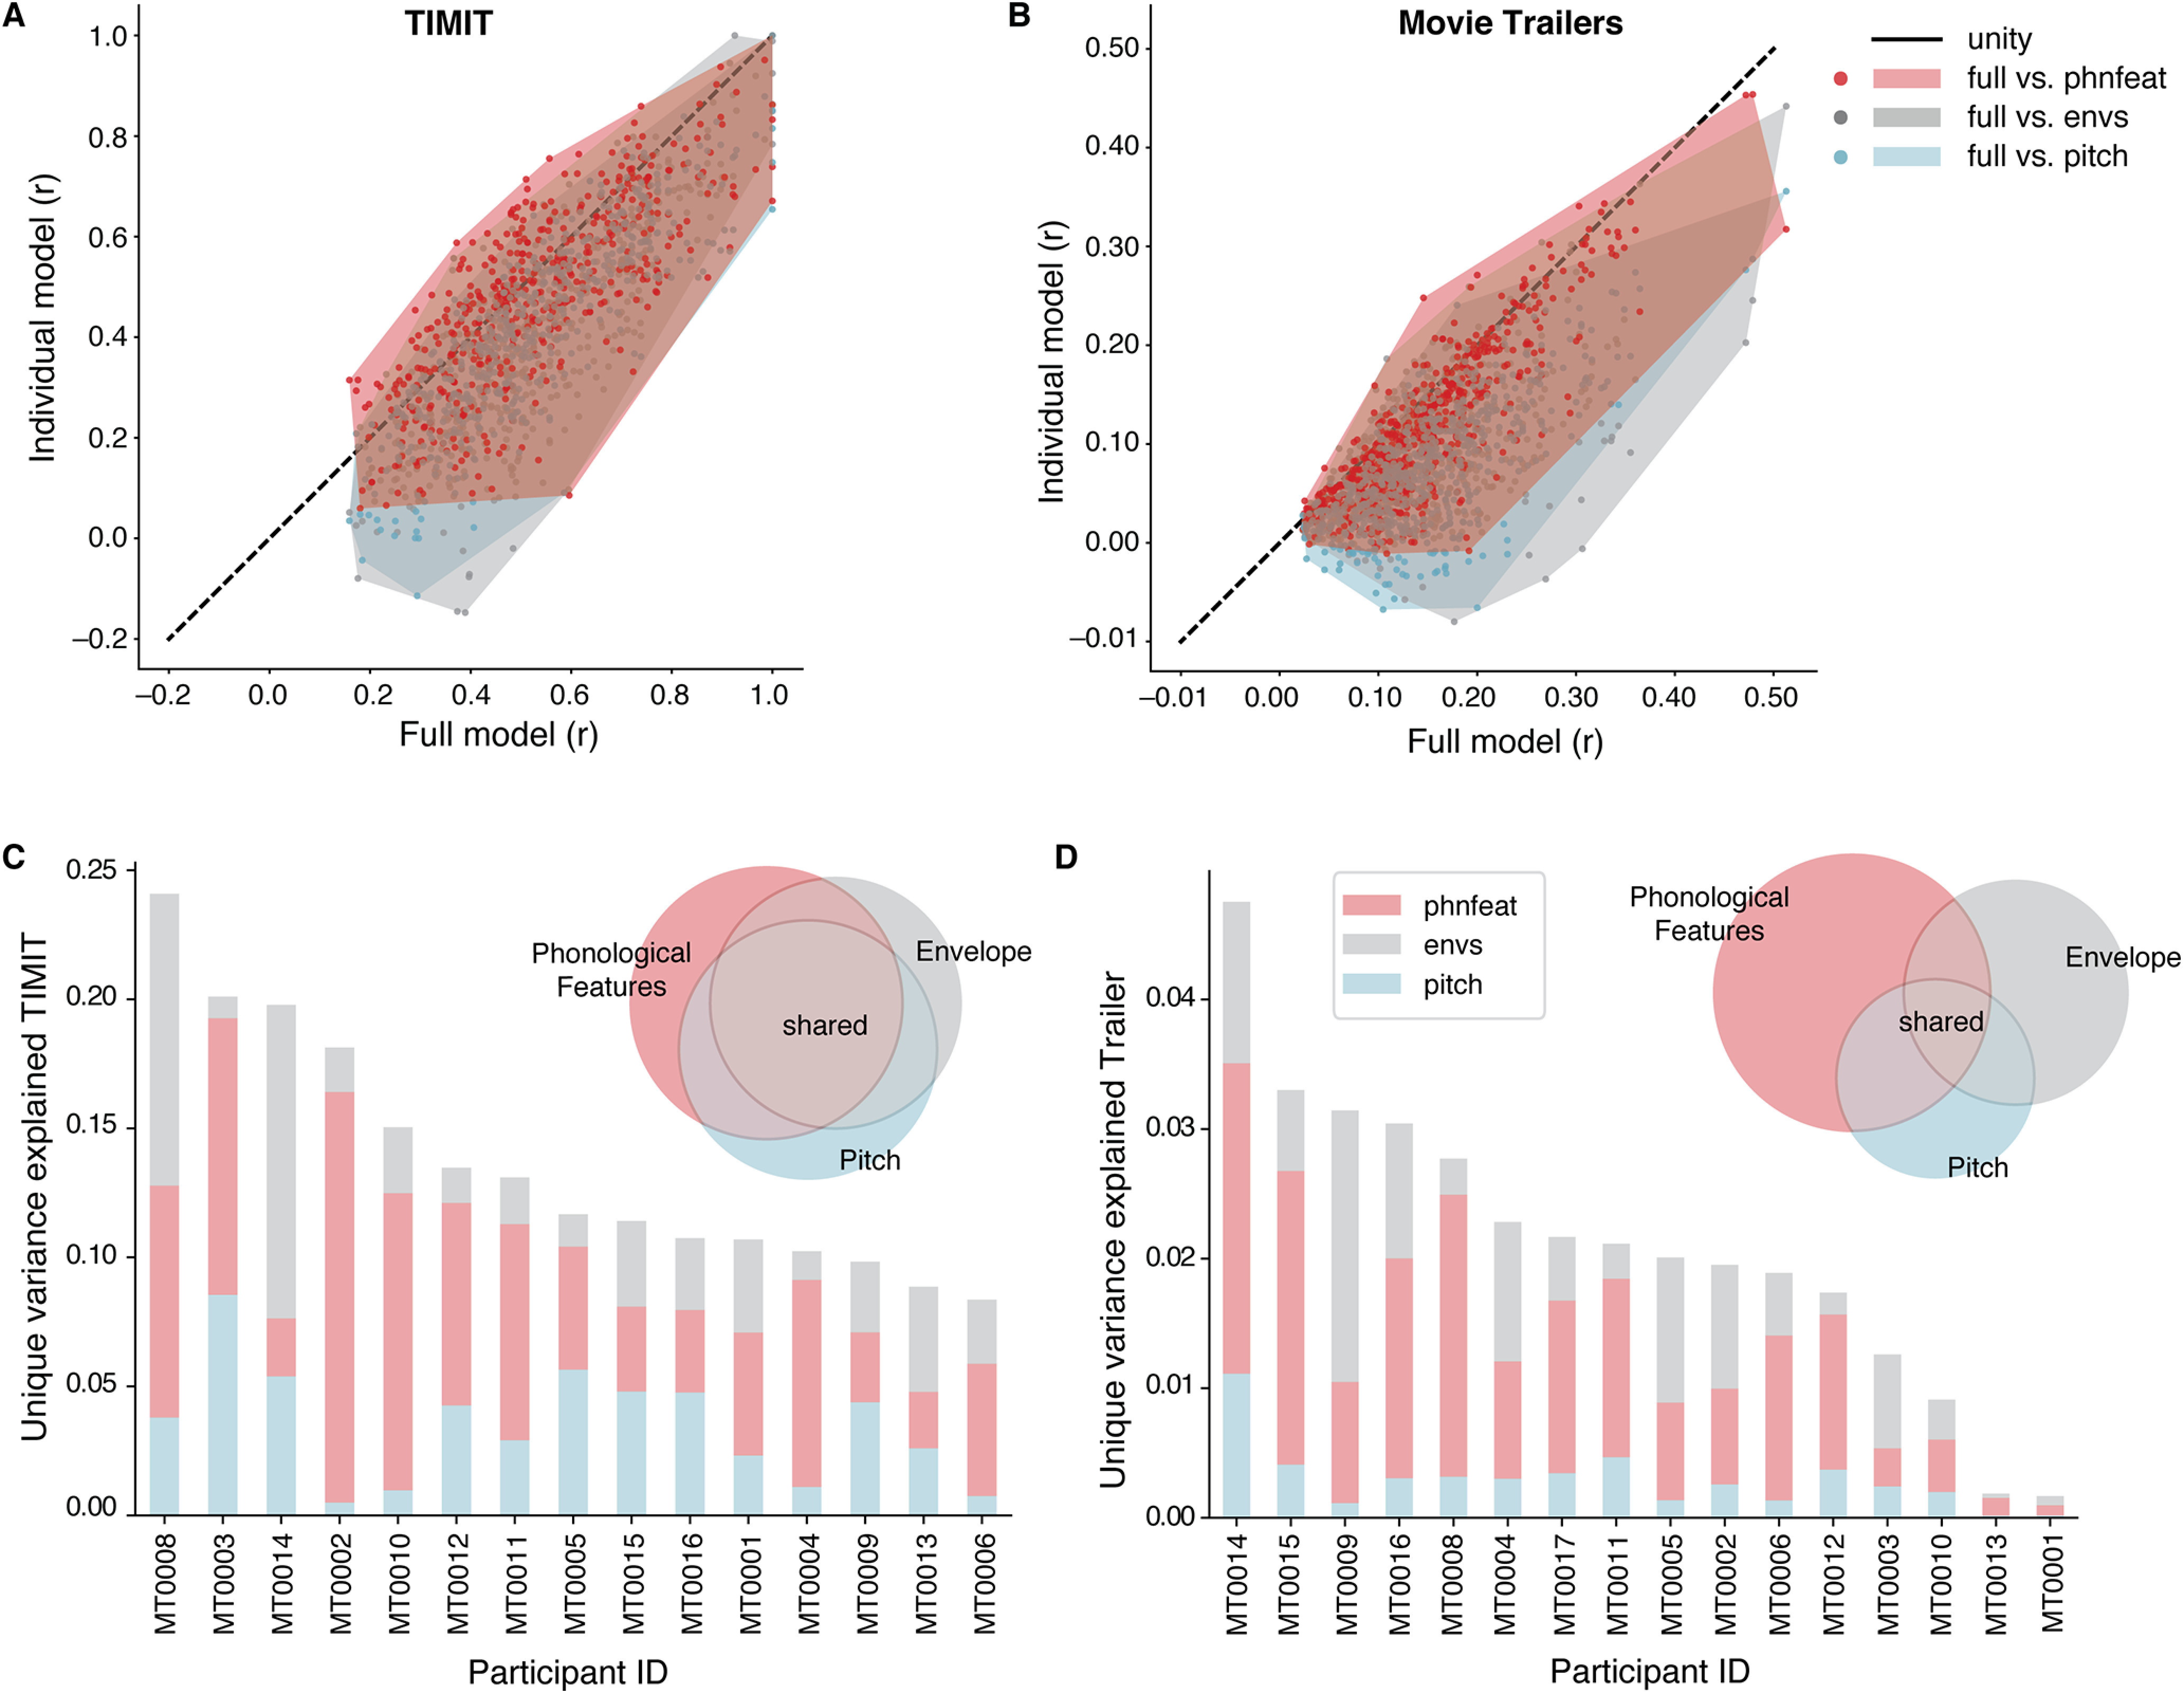
Figure 3.

Contributions of phonological and acoustic representations in predicting EEG. Comparing individual speech features (pitch, acoustic envelope, phonological features) with the full model (combination of all auditory features). A, Prediction performance (noise ceiling-corrected correlation between predicted and actual EEG data) of significant electrodes for each condition in models fit using TIMIT responses. Each individual dot is a single electrode. The shaded regions indicate the convex hull around the scatter points for each comparison, to indicate how the points are distributed along, above, or below the unity line. B, Same as A, for movie trailers. C, Variance partition analysis shows the unique variance explained by individual features (phonological features, pitch, and envelope) for each participant separately (bar chart) and across all participants (pie chart) when fit on TIMIT data. D, Same as C, for movie trailers condition.
