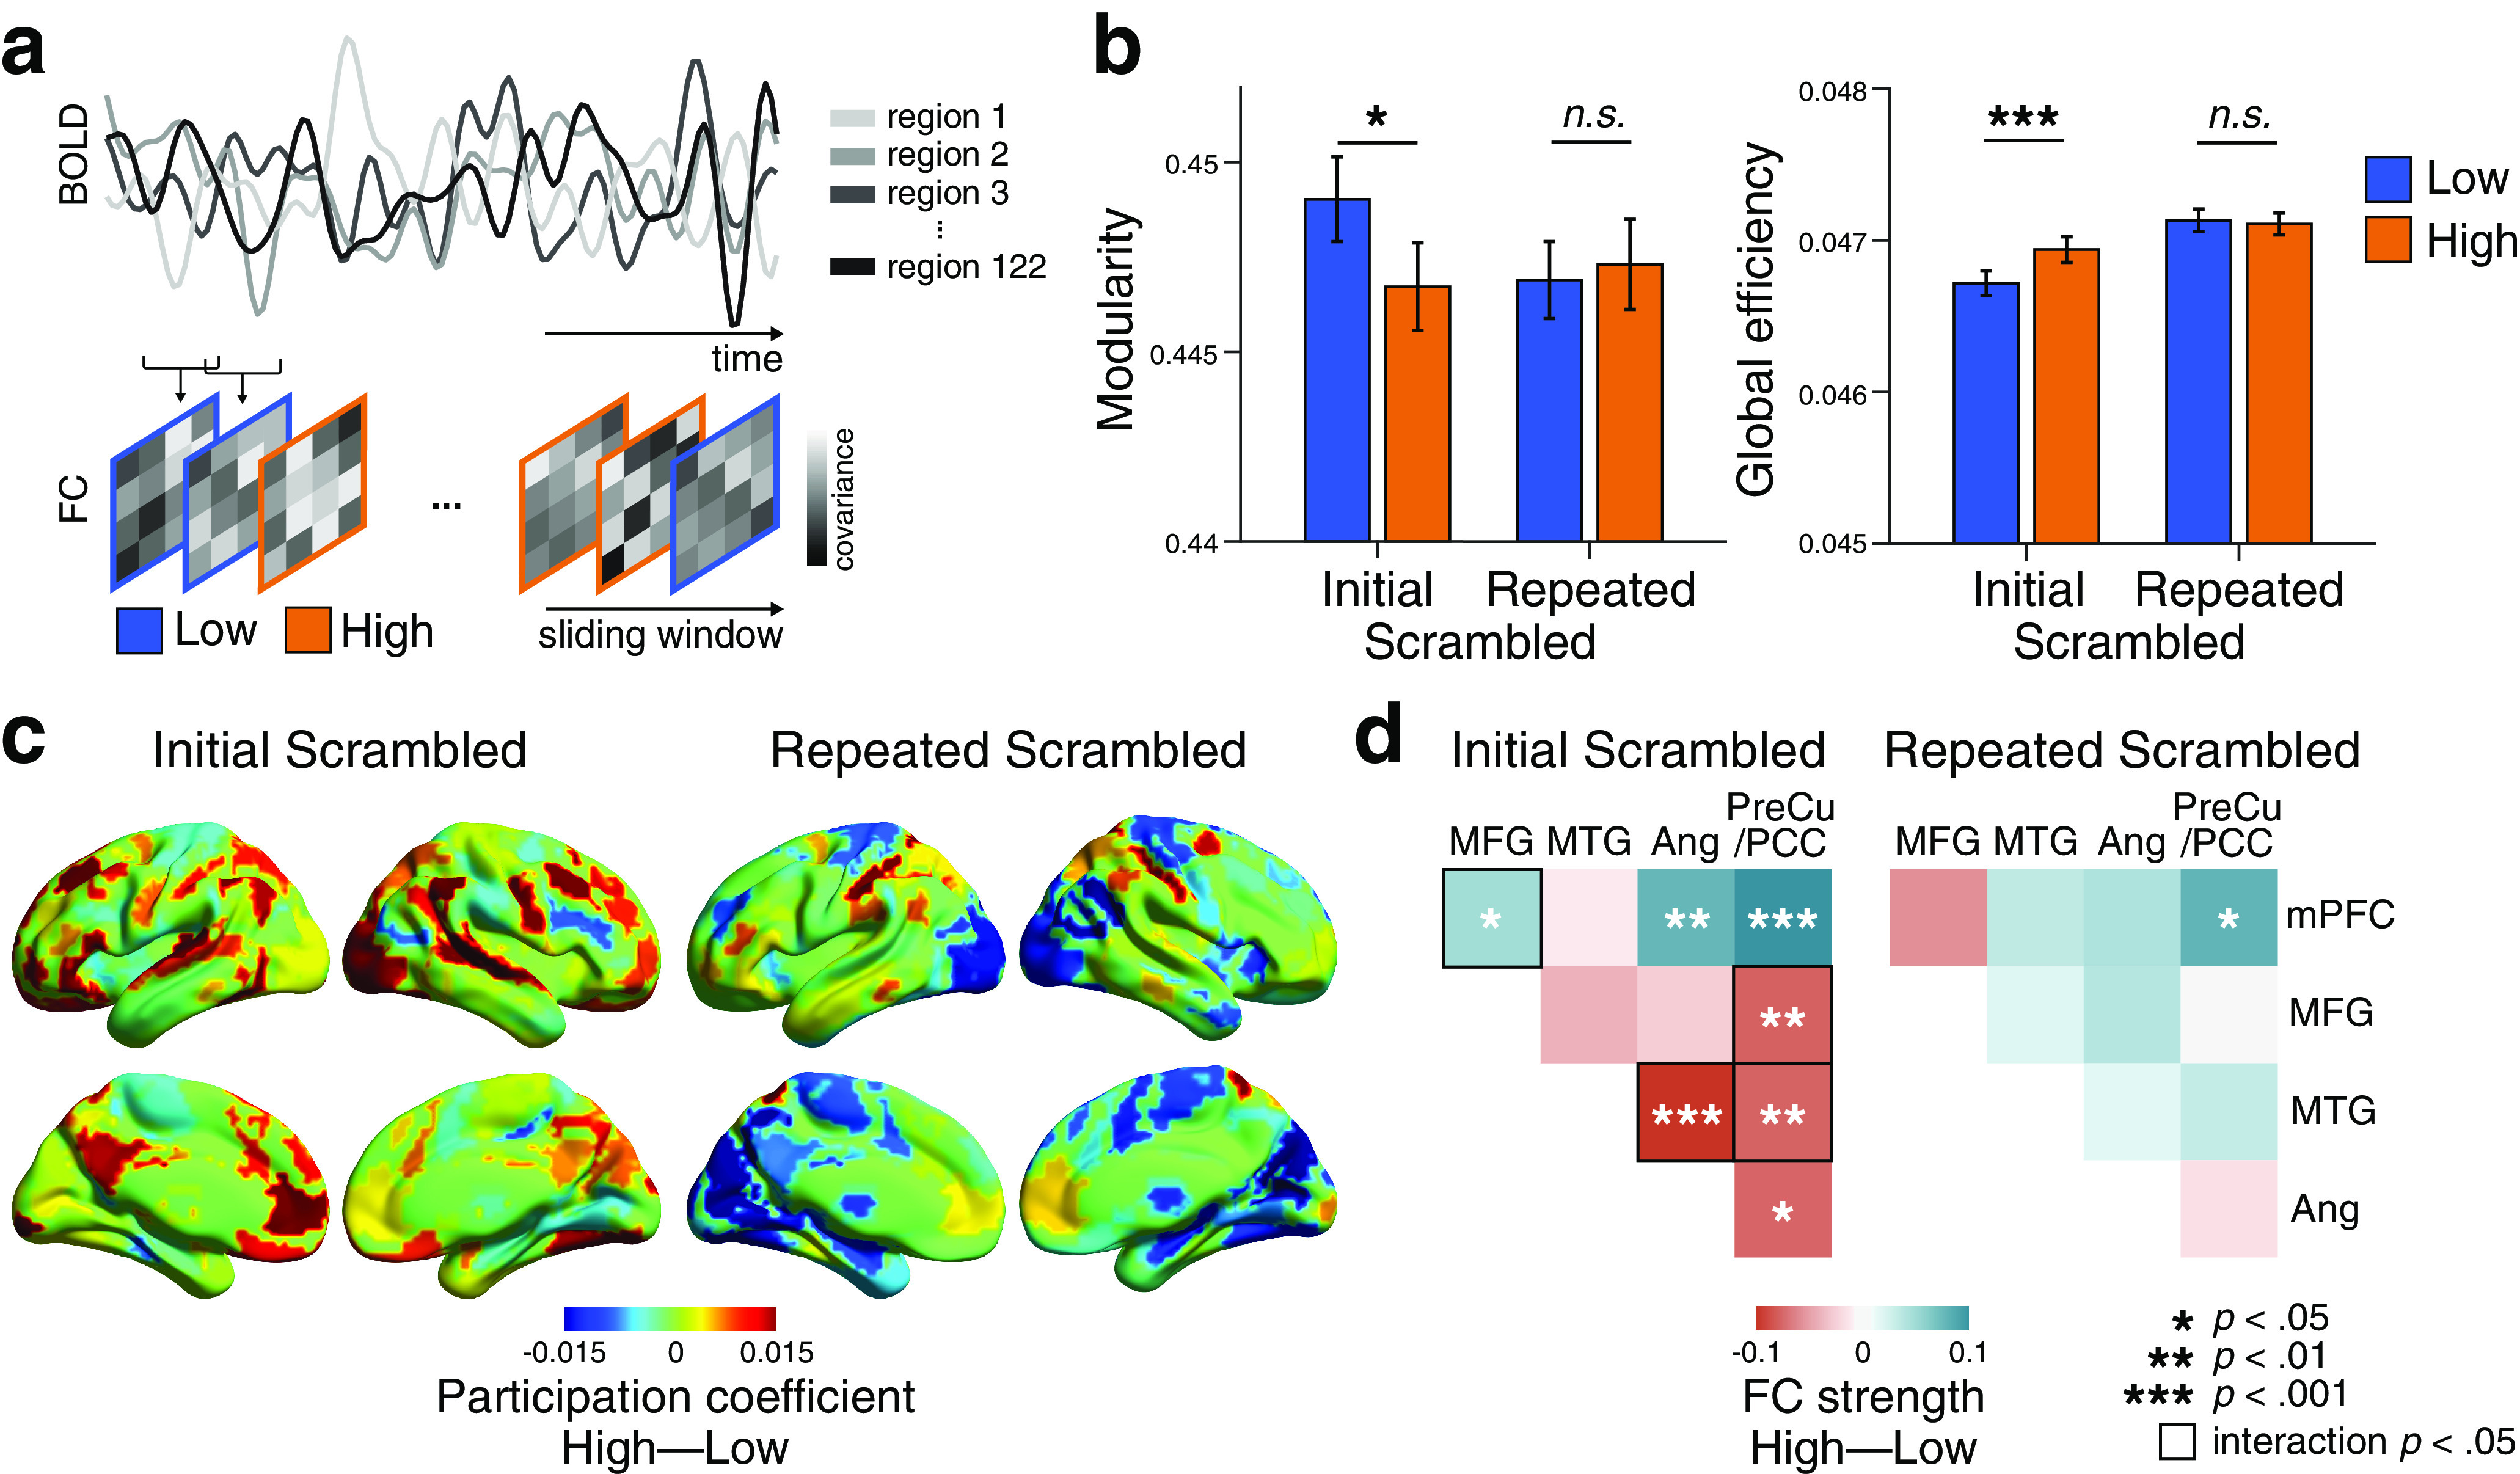
Figure 5.

Dynamic reconfiguration of large-scale functional networks at moments of high and low comprehension. a, Schematic overview of the time-resolved FC analysis using a sliding window. The BOLD time series was extracted from 122 ROIs (Yeo et al., 2011, 2015). Time-resolved FC matrices were constructed for each window across movie duration, and graph-theoretical network measures were computed from each FC matrix. Network measures were categorized by their correspondence to the cognitive states of either high or low comprehension, averaged within a participant, and were compared at group level. The analyses were conducted on all participants using three movie stimuli (N = 67). b, Global network reconfiguration corresponding to cognitive state differences. Modularity and global efficiency representing high- and low-comprehension moments were compared, for both the Initial and Repeated Scrambled conditions. Error bars indicate ±1 SEM. c, Differences in participation coefficients (a regional network measure of across-modular connections) between high- and low-comprehension moments, for the Initial (left) and Repeated (right) Scrambled conditions. The difference in participation coefficients was calculated per ROI and averaged across participants. Positive values (red) indicate that the regions exhibited higher participation coefficients during high-comprehension moments, whereas negative values (blue) indicate that the regions exhibited higher participation coefficients during low comprehension overall. The figure is visualized using BrainNet Viewer (Xia et al., 2013). d, Difference in the FC strengths of the pairwise subregions of the DMN between high- and low-comprehension moments, for the Initial (left) and Repeated (right) Scrambled conditions. Colors represent FC strength differences, averaged across participants. The FC strength of high- compared with low-comprehension moments was compared per regional pairs. Square contour represents pairwise DMN subregions that showed significant interaction effects between Scrambled conditions and comprehension states. The significance was FDR-corrected for the number of regional pairs.
