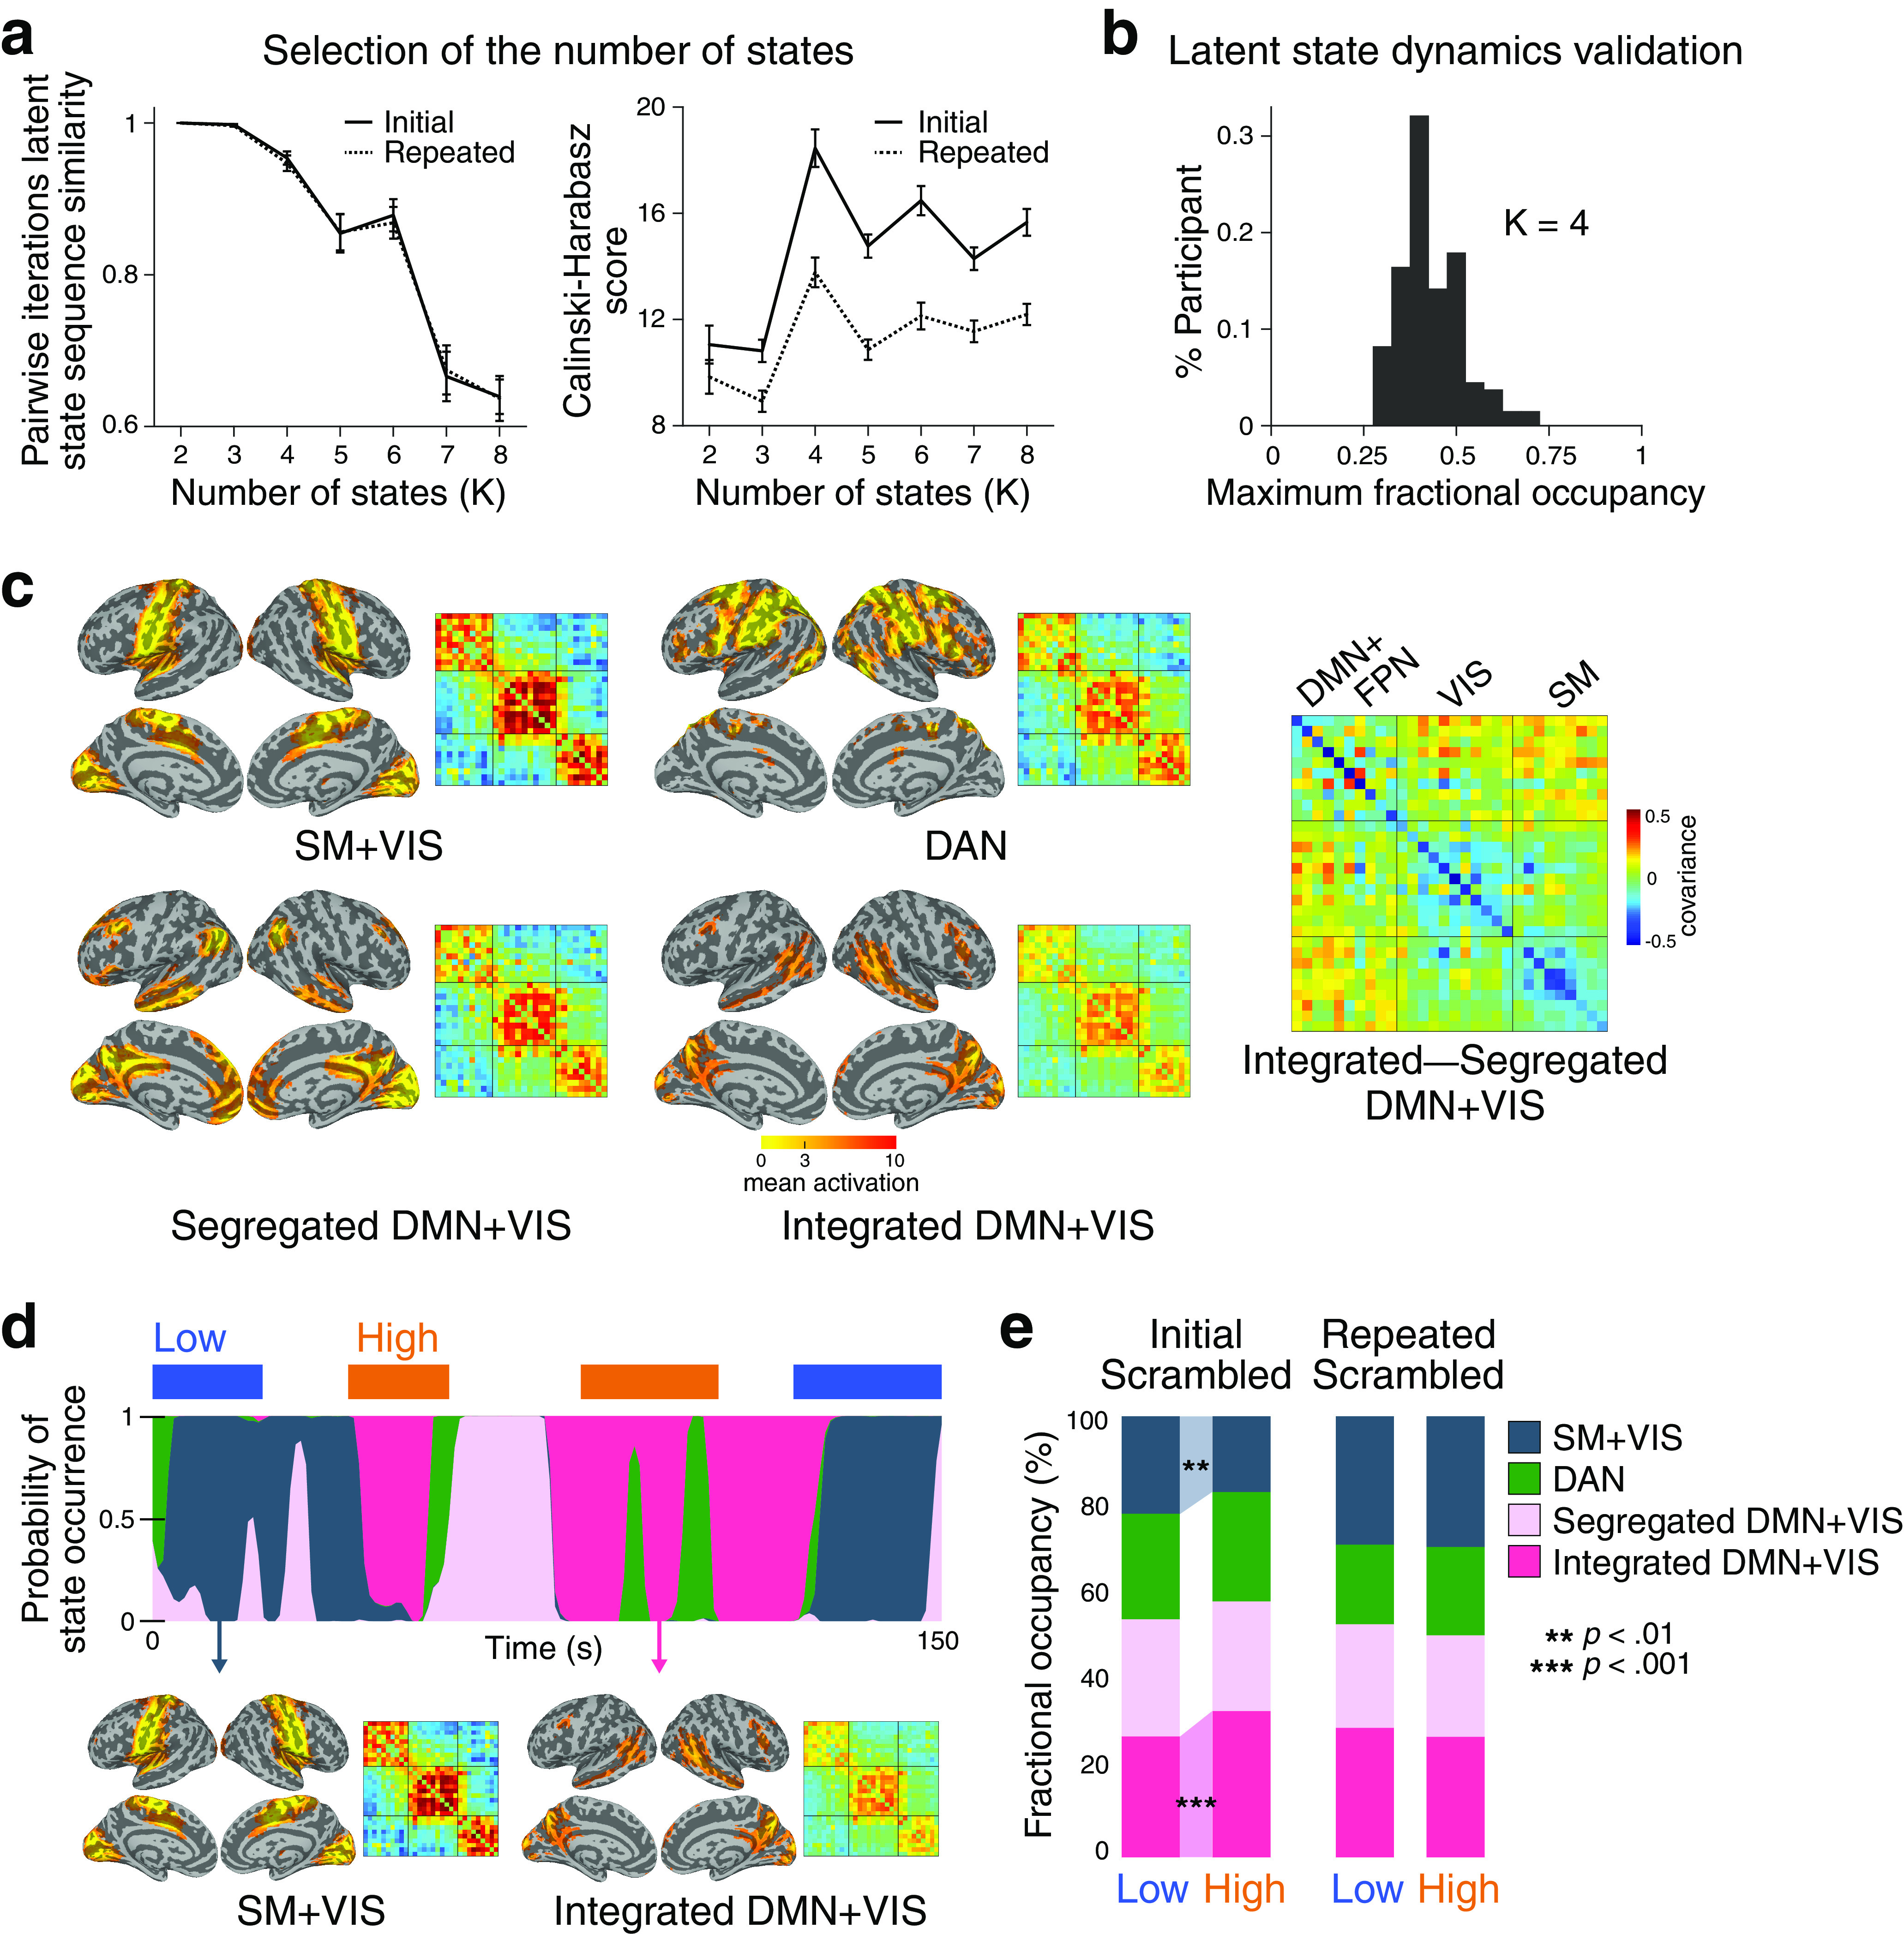
Figure 6.

Brain state dynamics underlying narrative comprehension, derived from HMM. a, Selection of the number of latent states (K) based on the model's consistency and clustering performance. Left, Model consistency is represented by the mean pairwise similarities of the predicted latent state sequence over five repeated iterations. Right, The model's clustering performance is represented by the ratio between the within-cluster and between-cluster dispersions of the observed IC time series (N = 67), with the clusters predicted by the HMM. A K value of 4 was chosen as the optimal number of states, given their high consistency and clustering performance among possible K values. b, Validation of the dynamics in the inferred sequence from the HMM. The fractional occupancy of the highest emerging state was calculated as per the participant's inferred sequence. c, Activation patterns and functional covariance of the four latent states, identified by training the HMM with the Original condition. The SM+VIS, DAN, Segregated DMN+VIS, and Integrated DMN+VIS were labeled based on their spatial activation patterns corresponding to the eight predefined functional networks. Right, The covariance matrix shows the difference between the covariance matrices of the Integrated DMN+VIS and Segregated DMN+VIS. d, State occupancy and transition dynamics of a representative participant during exemplar moments of the Initial Scrambled condition. Occurrences of the states were probabilistically inferred at each time point (Vidaurre et al., 2017, 2018). Discrete latent states, assigned from the state with the highest probability of occurrence at respective time points, were related to the binary group measure of comprehension. e, The average fractional occupancy of the four latent states during the moments of high and low comprehension, in the Initial and Repeated Scrambled conditions (results from all three movie stimuli, N = 67). Highlighted background between the colored bars represents significant differences in fractional occupancies, FDR-corrected for the number of states.
