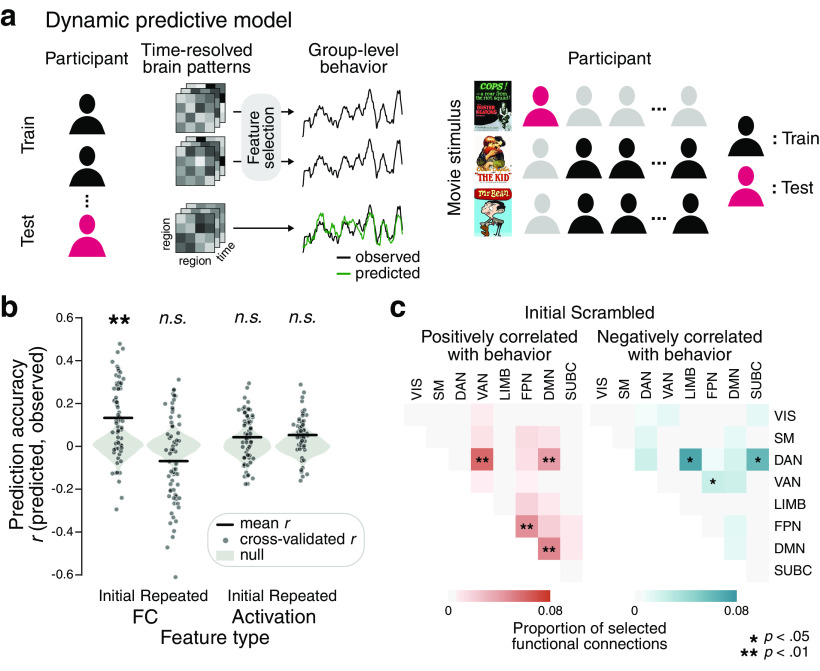
Figure 8.
Prediction of the moment-to-moment cognitive states of narrative comprehension from brain patterns. a, Schematic illustrations of dynamic predictive modeling. The model learns the relationship between time-resolved brain patterns (i.e., FC patterns or BOLD activation patterns) and time-resolved cognitive states (i.e., a group-aggregate behavioral measure of comprehension). The brain patterns and a behavioral estimate at every time point from all training participants are treated as independent observations during model training. Feature selection is conducted such that the brain patterns that are significantly correlated with behavioral measures are selected as model features. The trained model is then applied to a held-out individual to predict evolving cognitive states from selected brain features. Prediction accuracy is computed as the Pearson's correlation between the predicted (green line) and observed (black line) behavioral time courses, averaged across cross-validation folds. A cross-validated model is applied to a held-out participant's held-out movie watching scan, from a model trained from the rest of the participants' movie watching scans of different movie stimuli. b, Linear SVR model prediction accuracy (results from all three movie stimuli, N = 67). FC pattern-based and activation pattern-based predictions were conducted for the Initial and Repeated Scrambled conditions. Sixty-seven cross-validated prediction accuracies (gray dots) were averaged, and the mean accuracy (black lines) was compared with the null distribution (gray violin plots) in which the same model predicted phase-randomized group measures of comprehension (one-tailed test). c, The proportions of functional connections that were selected in every cross-validation fold during the Initial Scrambled condition, grouped by predefined functional networks. The triangular matrices represent the proportion of functional connections that were positively (left) or negatively (right) correlated with comprehension measures. The functional network pairs of which the proportion of selections was significantly higher than chance are indicated with asterisks (one-tailed test, FDR-corrected for the number of network pairs). LIMB, Limbic network; SUBC, subcortical network.

