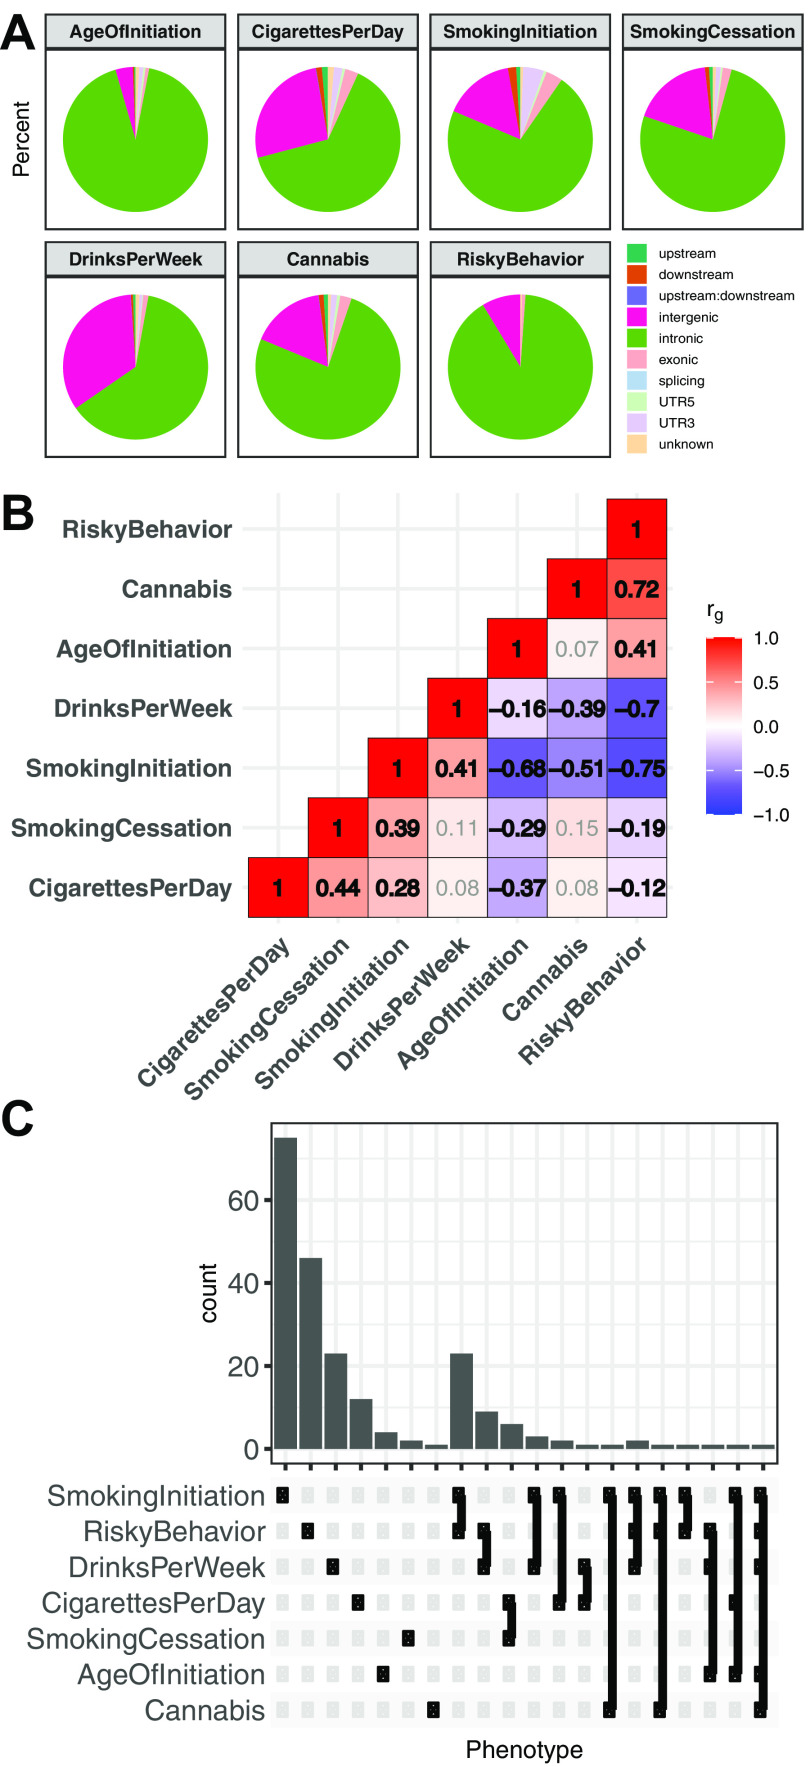
Figure 1.
Shared and unique genetic architecture of genetic risk variants of addiction-associated traits. A, Pie chart of ANNOVAR-annotated (K. Wang et al., 2010) SNP function of addiction-associated trait lead and off-lead SNPs in LD R2 > 0.8. Dark colors represent untranscribed/noncoding annotations; light colors represent transcribed/exonic annotations. SNP annotation labels are according to ANNOVAR using ENSEMBL build 85 gene annotations (see Materials and Methods). B, Pairwise LDSC genetic correlation (rg) matrix of seven addiction-associated traits. Bold represents FDR-significant correlations. Gray represents nonsignificant correlations (FDR < 0.05). C, UpSet plot of nonoverlapping genomic loci shared or unique to each addiction-associated trait. Genomic loci are clustered and identified by shared GWAS-significant SNPs and genomic region overlap.

