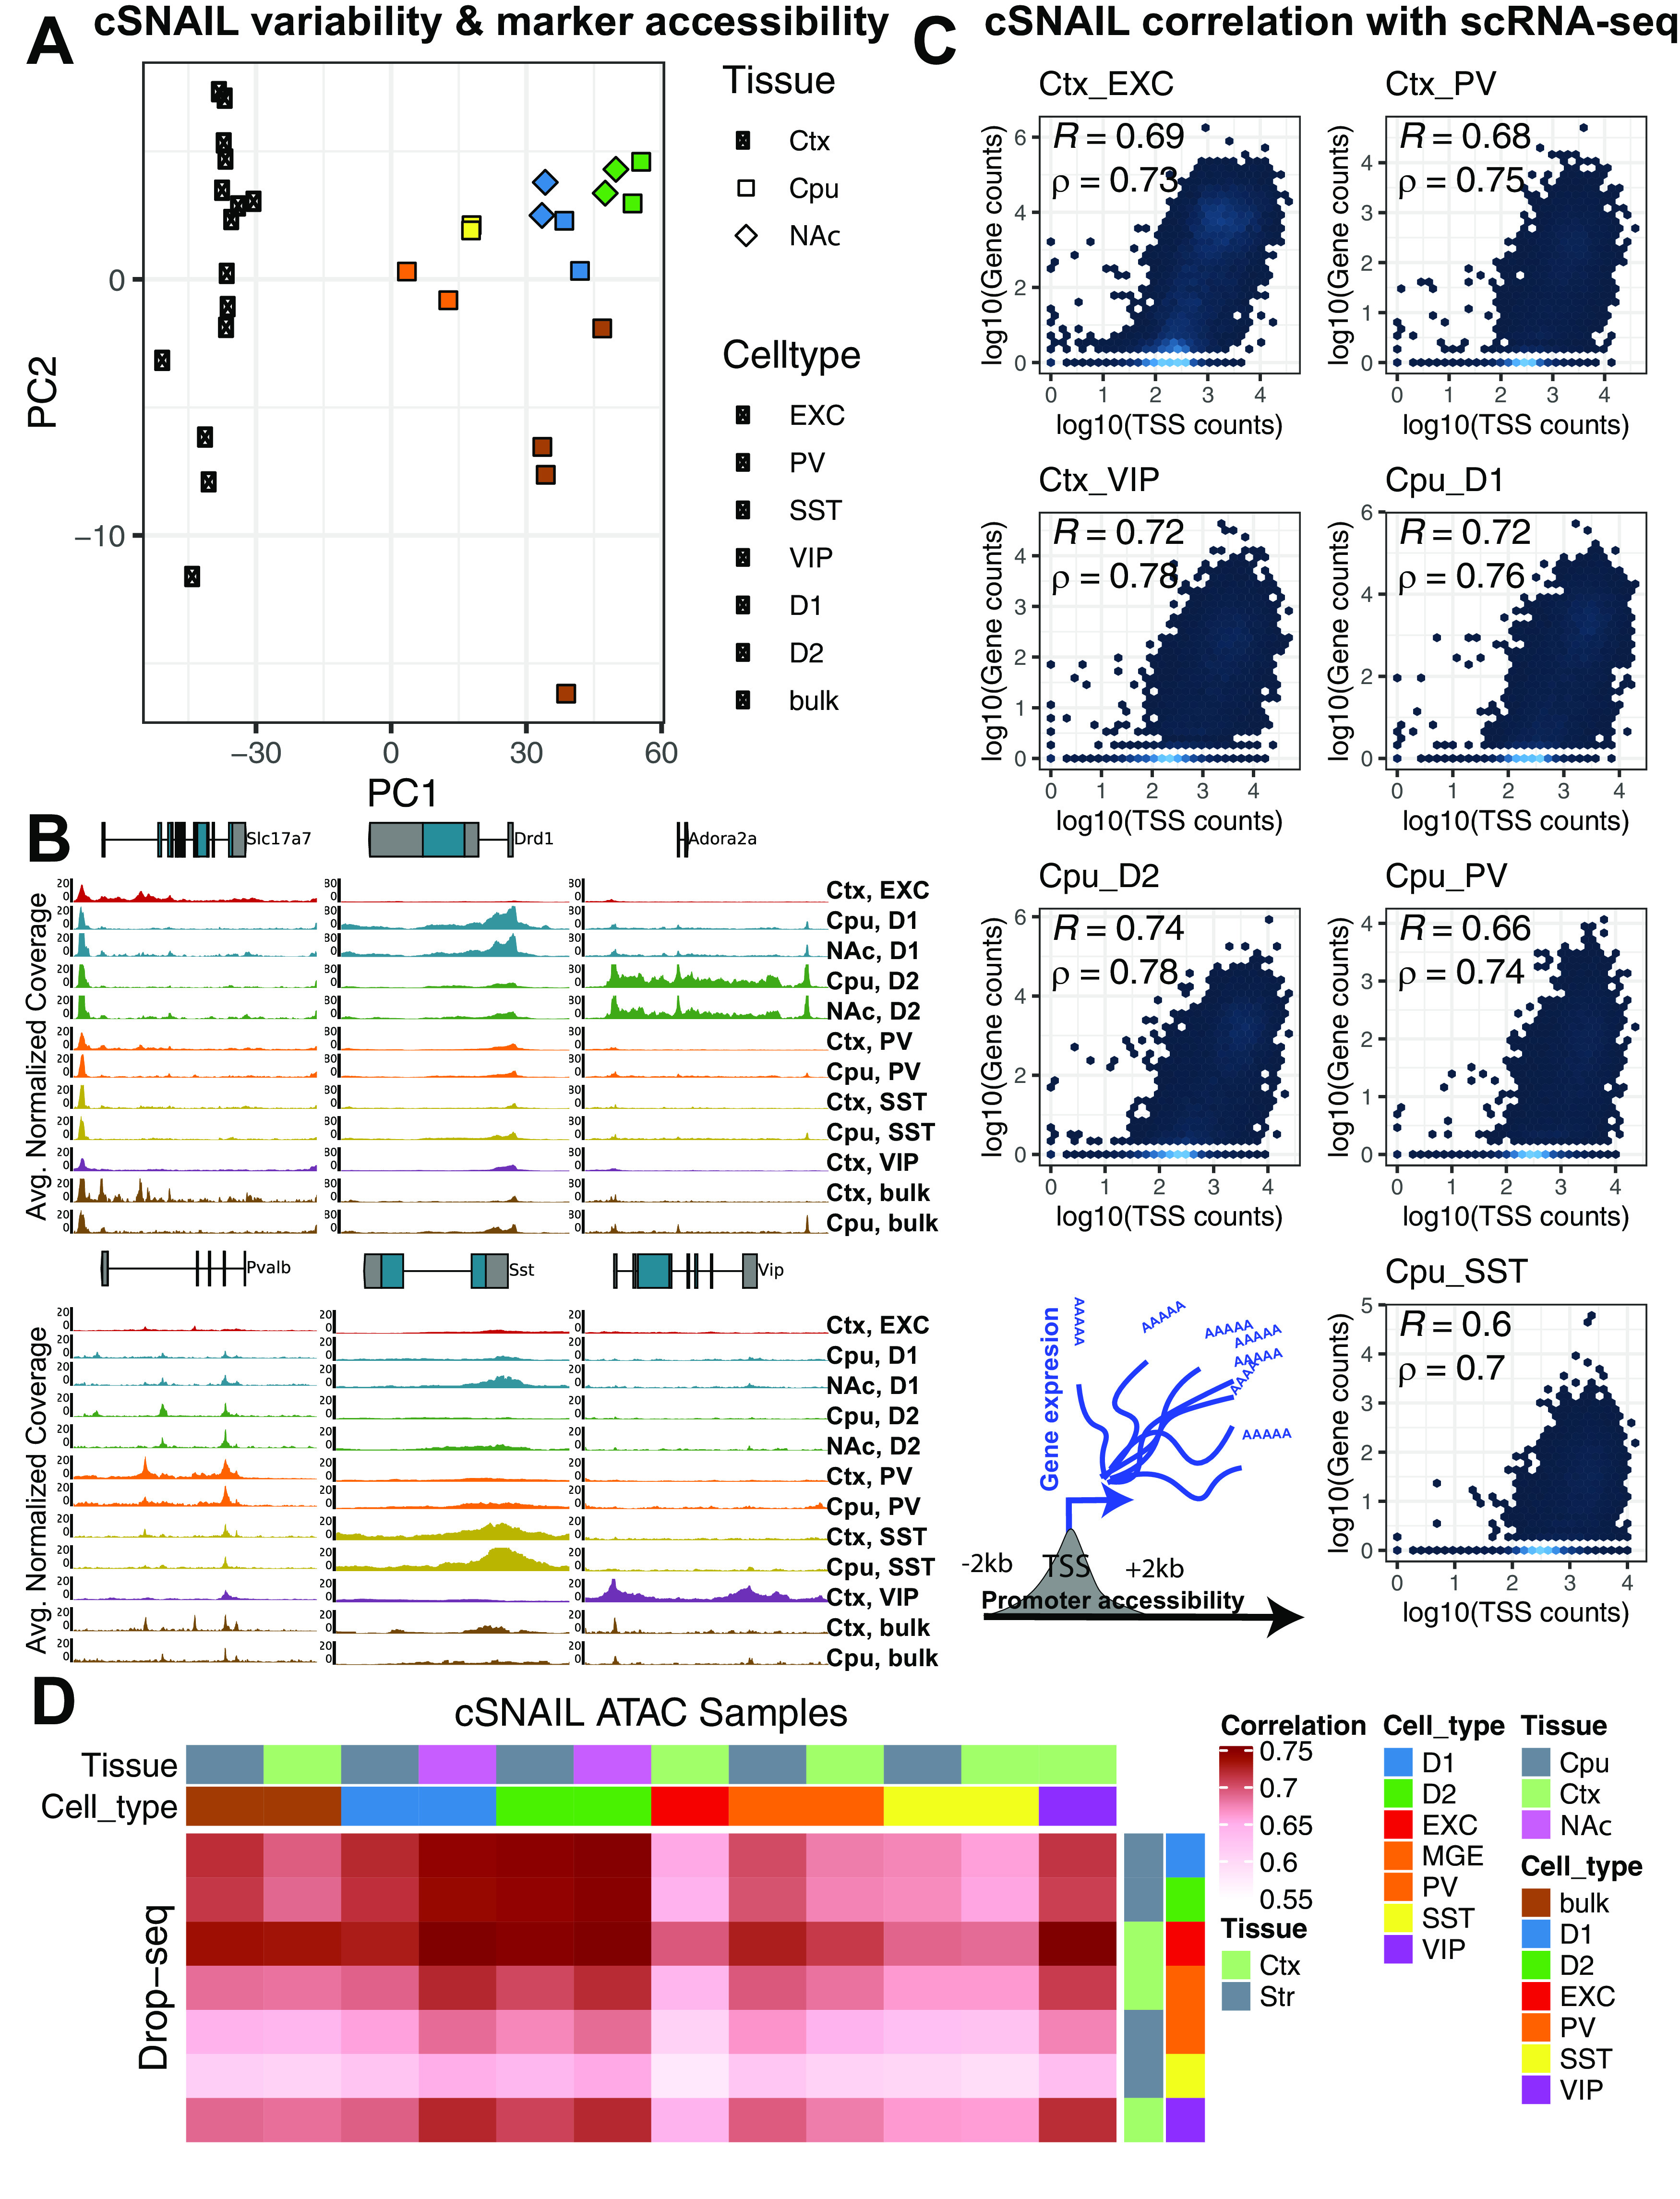
Figure 4.

Cell type specificity of cSNAIL ATAC-seq in mouse cortex and striatum. A, Principal component plots of chromatin accessibility counts from cSNAIL ATAC-seq from cre-driver lines (see Materials and Methods; sample sizes in Extended Data Table 4-1). Major axes of variation separate cell types by tissue source (PC1) and cell type versus bulk ATAC-seq (PC2). B, Normalized coverage track plots around marker genes demarcating cell type specificity of cSNAIL ATAC-seq samples. C, Density correlation plot of normalized chromatin accessibility log counts around the TSSs correlated with matched pseudo-bulk cell type log gene counts from Drop-seq of mouse cortex and striatum (Saunders et al., 2018). Drop-seq cell types meta-gene profiles report sum gene counts for cell clusters from frontal cortex and striatum. R and ρ indicate Pearson's and Spearman's correlation, respectively. D, Pairwise correlation matrix of TSS chromatin accessibility log counts with Drop-seq pseudo-bulk log gene counts from cortical and striatal cell clusters.
