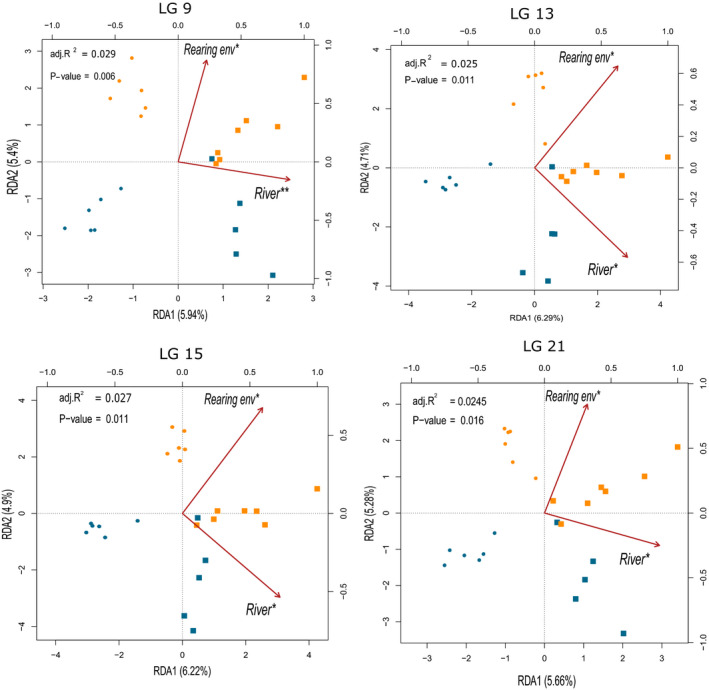
FIGURE 1.

Local distance‐based analysis (db‐RDA) performed with average methylation level through 1 kb window‐size on Coho salmon milt samples for chromosomes 9, 13, 15, and 21. Symbols represent the river: circles for Conuma and squares for Quinsam. Colors represent rearing environment: blue for hatchery‐born and orange for wild individuals. All db‐RDA were significant and explained 1.1%–2.9% of the global DNA methylation variation (adj. R 2 is displayed in upper left of each graph). Partial db‐RDA revealed that river of origin and rearing environment explained, respectively, 1.4%–1.7% and 1.1%–1.2% of the variation after controlling for the other variable
