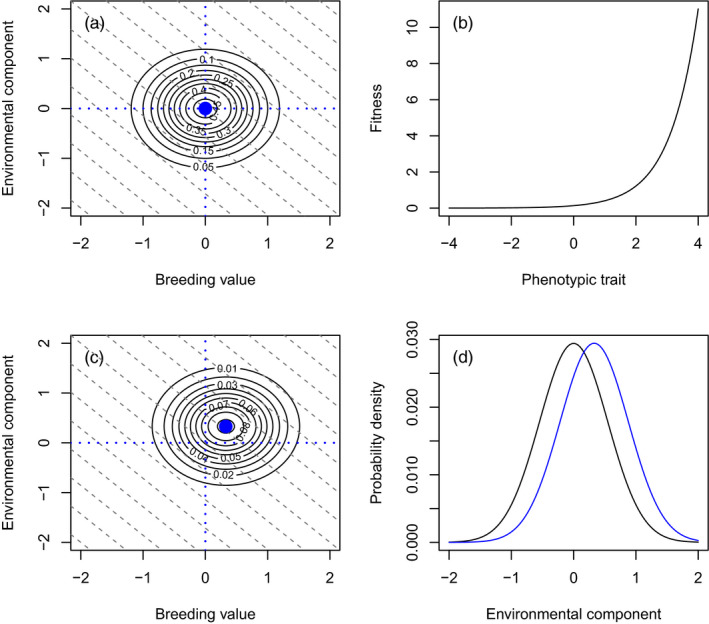
FIGURE 1.

Action of selection on a phenotypic trait described as a bivariate distribution of A and E. (a) A bivariate distribution with and σAA = σEE = 0.5. Each dotted diagonal grey line represents the same value of the phenotype z = A + E. The dotted blue lines represent y = 0 and x = 0 and repeated in (c). (b) A fitness function, where life reproductive success increases exponentially with the value of the phenotype. (c) The outcome of applying the fitness function in (b) to the distribution in (a). The mean and have both changed, but the σAA and σEE have not. (d) The conditional distribution of E prior to selection in (a) and postselection in (c)
