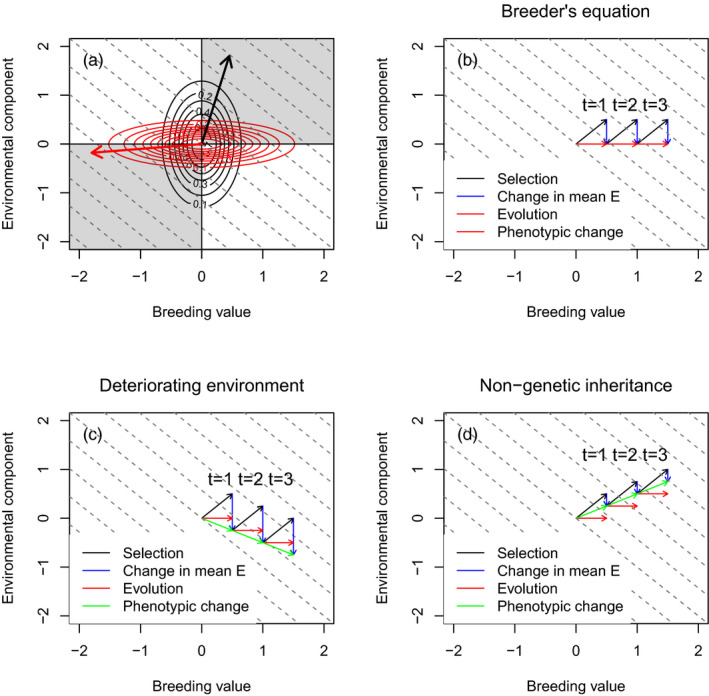
FIGURE 2.

Selection and evolution. (a) When selection operates on the phenotype z, selection on A and E is always in the same direction. The black lines represent a bivariate distribution of A and E where . The black vector (arrow) shows the direction of evolution if selection is directional and positive. The length of the arrow is arbitrary in this hypothetical example but in real numerical examples would represent the strength of selection. The red lines represent a bivariate distribution of A and E where . The red vector (arrow) shows the direction of evolution if selection is directional and negative. (b) The dynamics of the breeder's equation, where selection shifts the phenotype by altering both and black arrow. Rules of genetic inheritance are such that (red arrow). Rules of nongenetic inheritance mean that all gains made by selection on are lost and (blue arrow). In this case, change in the mean phenotype equals change in the mean breeding value . (c) When the environment deteriorates, and this leads to a temporal trend in the environmental component of the phenotype, evolutionary change (red lines) can be countered by change in (blue lines) that more than reverses any gains made by selection (black lines). The phenotypic trait mean (green line) can change in a direction opposite to that of selection. (d) When nongenetic inheritance is adaptive, it moves the mean phenotype (green line) in the same direction as selection. In this example, only a fraction of the effect of selection on the environmental component of the phenotype is passed across generations by nongenetic (compare black and green lines)
