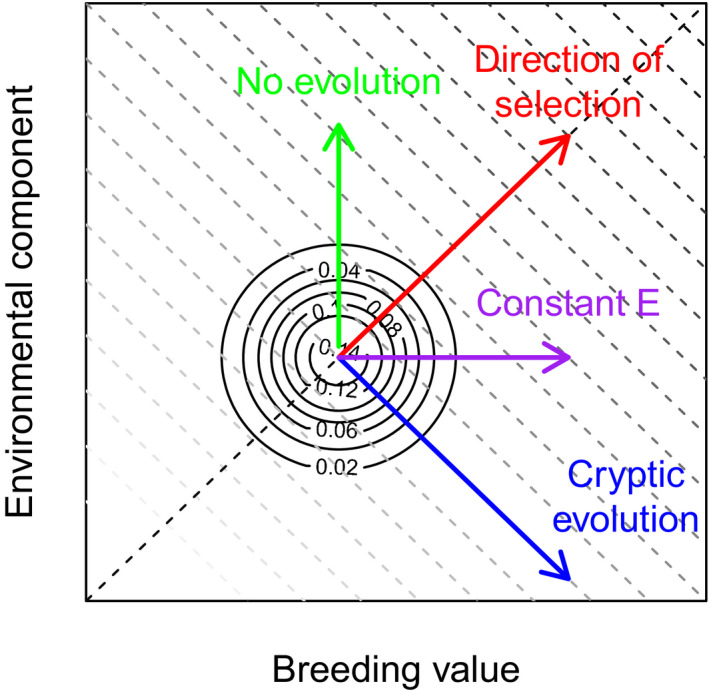
FIGURE 4.

A hypothetic example of evolution in bivariate space helping summarize our results. The diagonal lines represent constant phenotypic trait value clines, with the darker colour representing larger trait values (and when fitness is directional and positive) higher fitness. Because the additive genetic variance equals the variance in the environmental component of the phenotype, the vector describing the direction of selection is at 45 degrees (red line). In both our models, selection is in this direction but the strength varies over time. The types of evolutionary dynamics model 1 produces are depicted by the purple arrow. In our second model, evolution is partly cryptic. When change in the dynamics of the mean breeding value is completely offset by nonadaptive change in the environmental component of the phenotype evolution is fast (not depicted), and the phenotypic trait does not change (remains on the same diagonal line) but its components change in opposing directions. The green line would represent a case where there is no additive genetic variance and all phenotypic change is attributable to the dynamics of the environmental component
