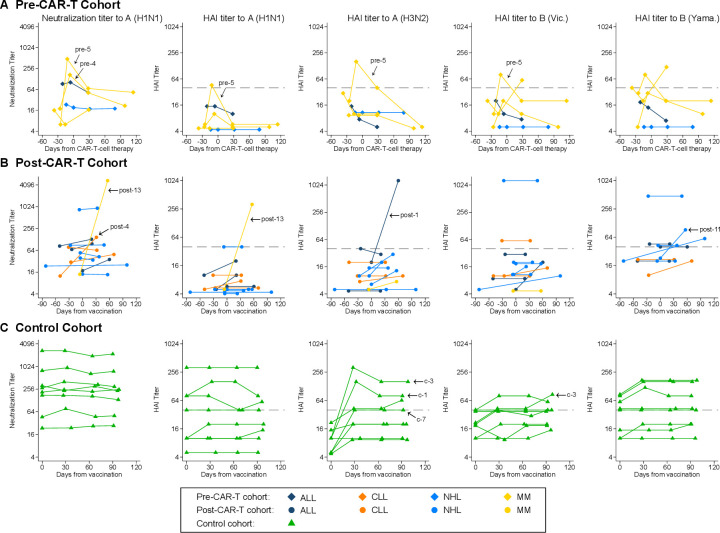
Figure 2.
Kinetics of influenza antibody titers by individual. Line plots demonstrating neutralization titers to A(H1N1) and hemagglutination inhibition (HAI) titers to A(H1N1), A(H3N2), B(Victoria), and B(Yamagata) for (A) the pre-CAR-T cohort, (B) the post-CAR-T cohort, and (C) the control cohort. Each line connects results from one individual over time. Individuals with antibody responses at the first postvaccine time point are indicated with an arrow and their study ID. Symbols on or above the dashed horizontal line represent HAI titers ≥40. For the pre-CAR-T cohort, day 0 was set at the day of CAR-T-cell therapy, vaccines were administered between 0 and 8 days after baseline sample collection (median, 0), and time between vaccine and sample collection prior to CAR-T-cell therapy ranged from 13 to 19 days (median, 14). For the post-CAR-T cohort and the control cohort, day 0 was set at the day of vaccination. individuals without confirmed receipt of a quadrivalent vaccine are excluded from the plots showing HAI titers to B(Yamagata). CAR-T, chimeric antigen receptor-modified T cell.

