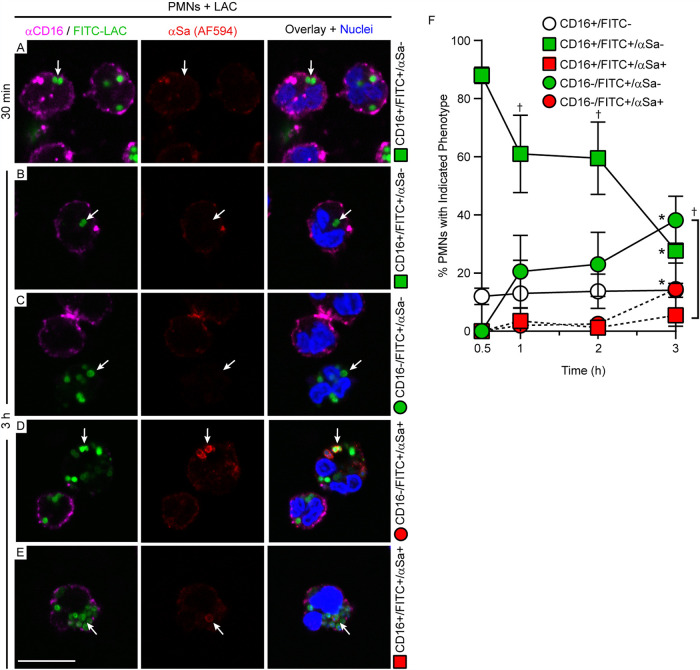
FIG 5.
PMN-S. aureus phenotypes as observed by confocal microscopy. For all panels, PMNs were combined with S. aureus for 30 min or 3 h, labeled with anti-CD16 antibody (αCD16), fixed with paraformaldehyde, permeabilized selectively with digitonin, and stained as indicated. (A, B) CD16-positive PMNs with intact S. aureus phagosomes (CD16+ FITC+ αSa− [anti-S. aureus negative]). (C) CD16-negative PMNs with intact S. aureus phagosomes (CD16− FITC+ αSa−) and a juxtaposed CD16+ PMN lacking S. aureus. (D) CD16-negative PMNs with disrupted S. aureus phagosomes (CD16− FITC+ αSa+) next to a CD16-positive PMN with intact phagosomes. (E) CD16-positive PMN with a single disrupted S. aureus phagosome (CD16+ FITC+ αSa+). Arrows in all panels indicate representative staining patterns for PMNs (and associated phagosomes) that were used to quantitate each phenotype as labeled on the right. Scale bar = 10 μm. (F) Quantification of the PMN-S. aureus phenotypes described for panels A to E. Green symbols and solid lines indicate intact phagosomes; red symbols and dashed lines indicate loss of phagosome integrity. Results are presented as the mean values ± SD from 4 separate experiments. Statistics were performed using repeated-measures nonparametric ANOVA (Friedman test) with Dunn’s posttest to correct for multiple comparisons. *, P < 0.05 for 3 h versus 0.5 h; †, P < 0.05 versus red square (2 h, 3 h) or red circle (1 h).

