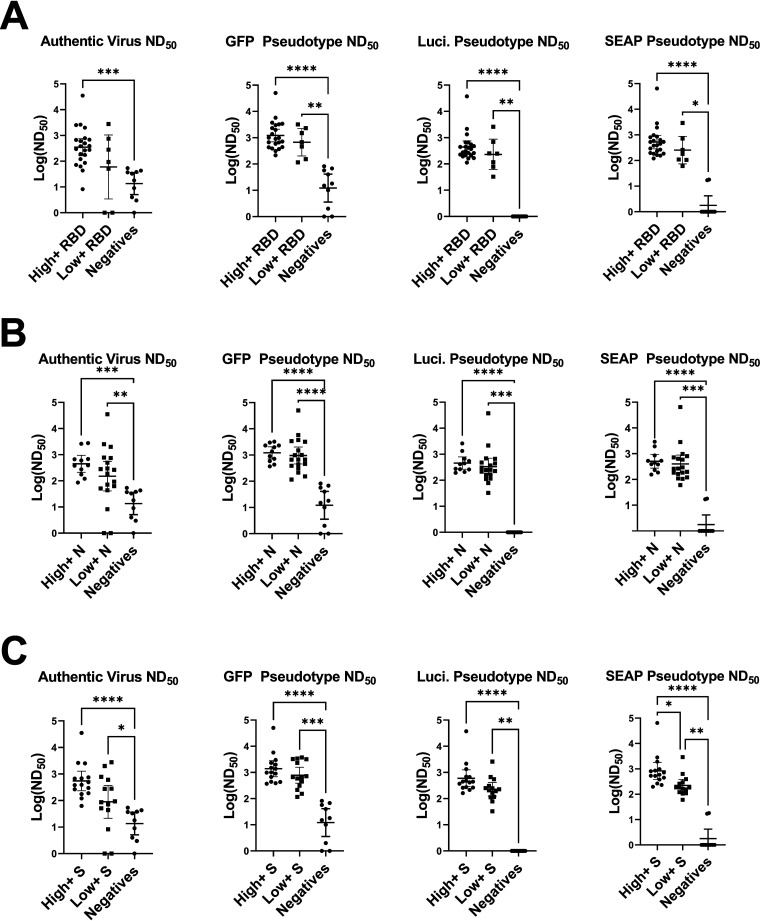
FIG 5.
Comparison of high-positive, low-positive, and negative ELISA groups across neutralization assays. (A) RBD-, (B) spike (S)-, and (C) nucleocapsid (N)-positive samples were divided into high and low positives by finding cutoff values using histograms (RBD ratio, 15; N ratio, 10, and spike value, 6). Log ND50 values for the corresponding samples were then graphed and compared by Kruskal-Wallis test with Dunn's multiple-comparison tests. Significance thresholds: *, P < 0.05; **, P < 0.01; ***, P < 0.001; ****, P < 0.0001.

