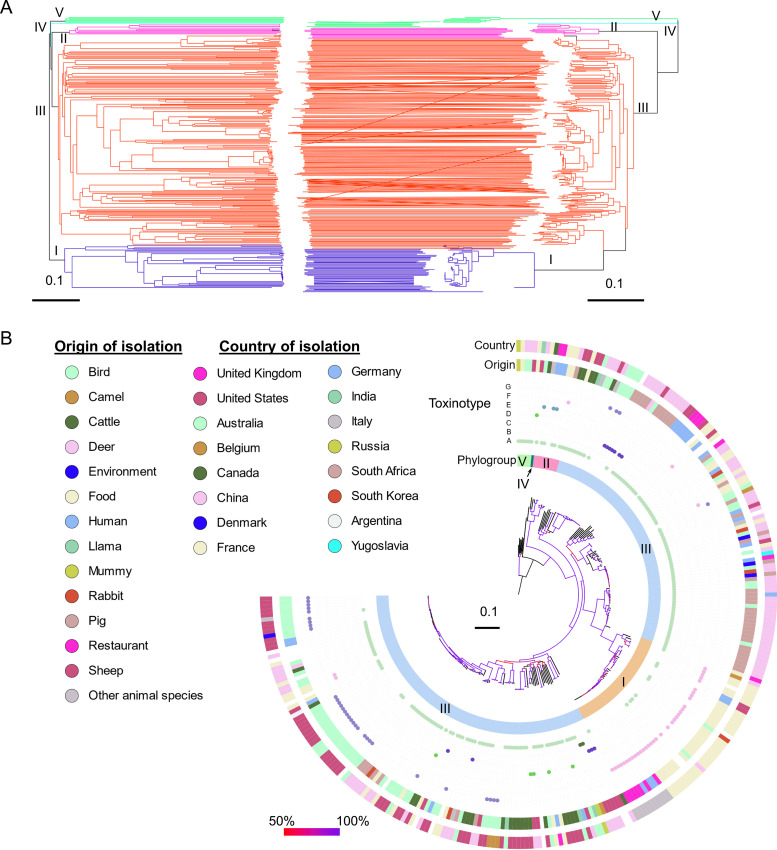
FIG 2.
Comparison between typing results of allele- and nucleotide-based analysis of core genome MLST target genes. (A) Topological correspondence between the cgMLST neighbor-joining tree (left) and the SNP-based maximum-likelihood tree (right) is shown as a tanglegram. The branches of the tree were color-coded based on the species phylogroups indicated on the branches. The tanglegram was generated using Dendroscope v3.2.1027. (B) Phylogenetic maximum-likelihood tree based on nonrecombinant SNPs identified in the 282 Clostridium perfringens genomes. It shows the population structure of the species with the five phylogroups highlighted next to the ML tree, followed by the predicted toxin types of the strains and the origin and country of isolation as in the legend. The phylogenetic tree was visualized using iTOL v5 (49).

