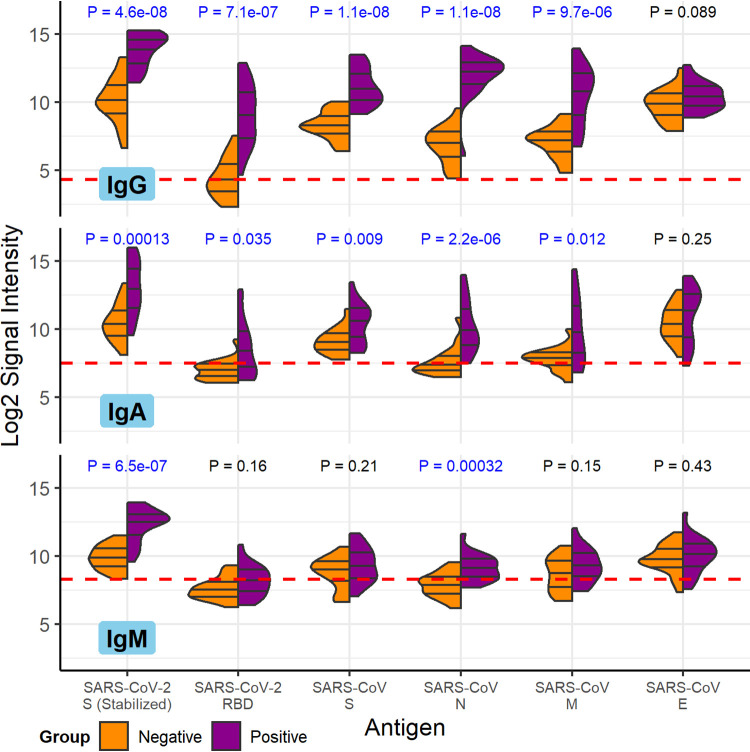
FIG 1.
COVID-19 patient and healthy control antibody reactivity with purified SARS-CoV-2 and SARS-CoV proteins. The split violin plot shows the log2-transformed fluorescence signal intensity distribution of antibodies bound to each purified protein on the multi-coronavirus protein microarray. Within each half-violin are three lines representing the interquartile range and the median. Above each split violin is the Wilcoxon rank sum P value, colored blue for significant P values below 0.05. The three panels are split by isotype (IgG, top; IgA, middle; IgM, bottom). Horizontal red dashed lines are drawn at the median of all signal intensities against purified proteins (n = 14) and peptides (n = 587) plus 1.0, i.e., double the global median; this threshold serves as a point of reference but not necessarily a seropositivity cutoff for each protein.

