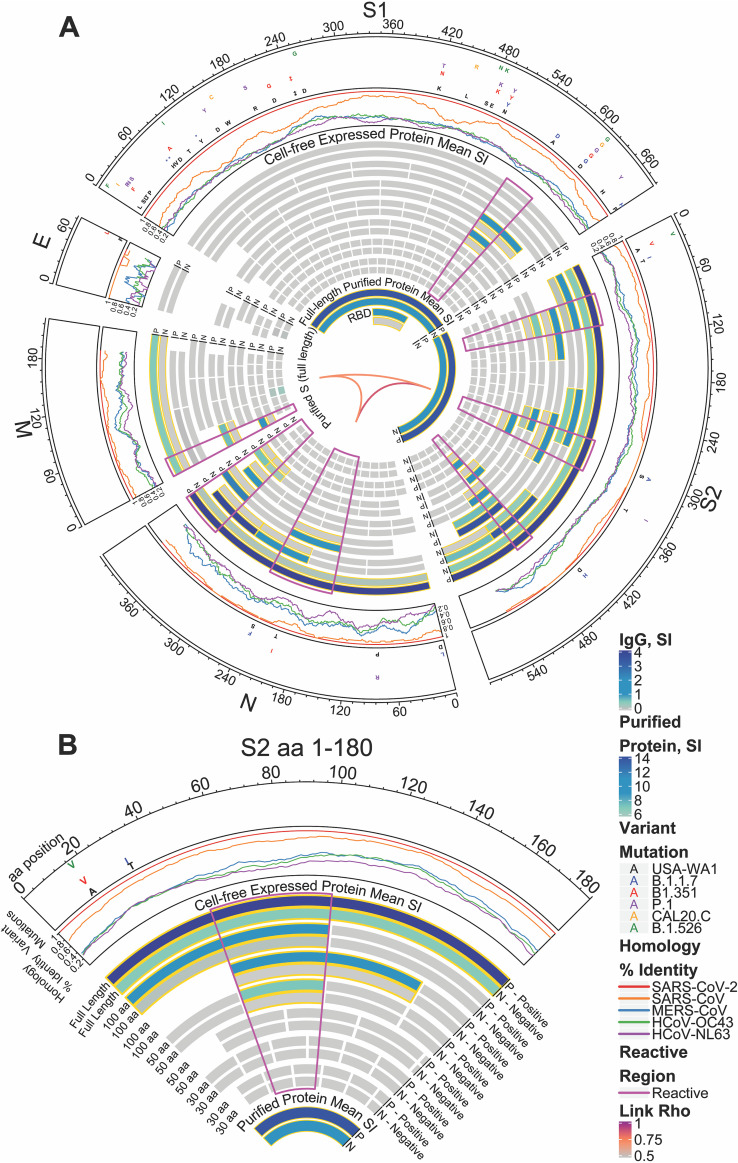
FIG 2.
Reactivity of COVID-19 patient and healthy donor IgG to SARS-CoV-2 proteins and protein fragments. (A) The circular graphic maps the amino acid (aa) position of SARS-CoV-2 fragments, showing a heat map of IgG levels in each group for overlapping regions of different amino acid length. Proteins are indicated outside the circle plot, followed by a line graph showing the sequence homology of other CoVs with SARS-CoV-2 for each gene. Mutations, relative to the USA-WA1 strain, found in circulating mutant virus strains are shown in the next circular segment. Proteins and protein fragments produced in vitro are indicated by bars and show the length and position of each fragment in each protein. Each fragment is drawn twice and shows the group mean normalized log2 signal intensity of IgG binding to each fragment for COVID-19-positive samples (P) and negative-control sera (N). The purified full-length S protein and the receptor binding domain (RBD) are shown for comparison. IgG signal intensity is shown by color gradient, from gray to blue. Bar pairs shown with a gold outline represent significantly differential IgG binding between COVID-19 patients and healthy controls, defined as a mean log2 signal intensity of ≥0.1 in at least one group and a t test P value of ≤0.05. The regions of greatest reactivity for each protein are outlined in magenta. The Pearson’s correlation coefficients (“Rho”) between each full-length protein for IgG binding are shown as links between protein sectors in the center of the circle. (B) A slice of the circular graphic is amplified and labeled in more detail as a guide to interpreting the full figure. The first 180-aa sequence of S2 is shown.

