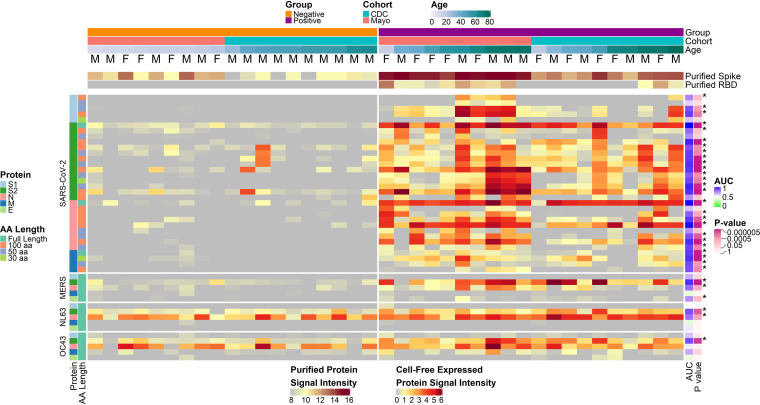
FIG 3.
COVID-19-positive and -negative sample IgG reactivity to coronavirus proteins and protein fragments produced in vitro. The heatmaps present the signals of IgG binding to individual proteins and protein fragments within the antigenic regions of SARS-CoV-2, as well as the full-length structural proteins of MERS-CoV, HCoV-NL63, and HCoV-OC43 for individual samples. Columns represent serum samples ordered by increasing age within group and cohort, and rows represent proteins or protein fragments, including 32 SARS-CoV-2 proteins or fragments and 5 proteins each of MERS-CoV, HCoV-OC43, and HCoV-NL63. IgG signal intensity is shown on a color scale from gray to red. Sample information is overlaid above the heatmaps and includes sex (M/F), group (negative or positive), cohort (CDC or Mayo), and age (years). Protein/fragment information is annotated to the left of the heatmaps and includes the virus, the full-length protein name, and the amino acid length of the protein fragments (“AA Length,” as full length, 100, 50, or 30 aa). The receiver operating characteristic area under the curve (AUC) and the unadjusted t test P value for each protein between negatives and positives are shown to the right of the heatmap. Asterisks next to the P values represent adjusted P values of <0.05.

