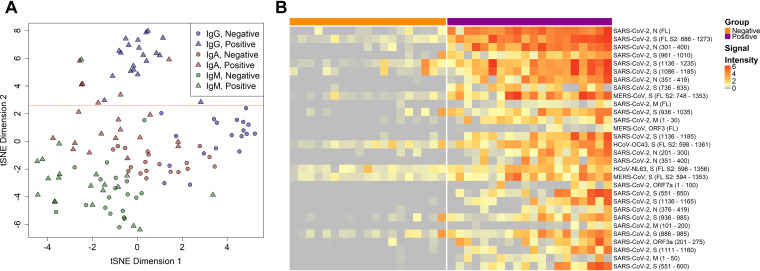
FIG 4.
IgG responses give the best delineation of COVID-19 patient sera from healthy donor sera. (A) The IgG, IgA, and IgM responses against the 30 most reactive IVTT proteins by means of all samples and isotypes were projected for each sample across two dimensions using t-distributed stochastic neighbor embedding (tSNE). Points represent individual samples and are colored according to the isotype measurement. The shape represents the group in which the sample belonged, either the negative healthy donor group or the positive COVID-19 patient group. The horizontal red dashed line (y = 2.6) separates the IgG responses in negative and positive individuals. (B) The heatmap shows the 30 most differentially reactive IgG responses to IVTT proteins between the negative and positive groups. Columns represent serum samples, separated by group with colored headers. Rows represent full-length or fragmented proteins produced by cell-free expression in vitro. The protein annotations to the right of the heatmap denote the virus, protein, and in parentheses, the amino acid range of the fragment or full-length “FL” protein. Normalized log2 signal intensity is displayed on a gray to red color scale.

