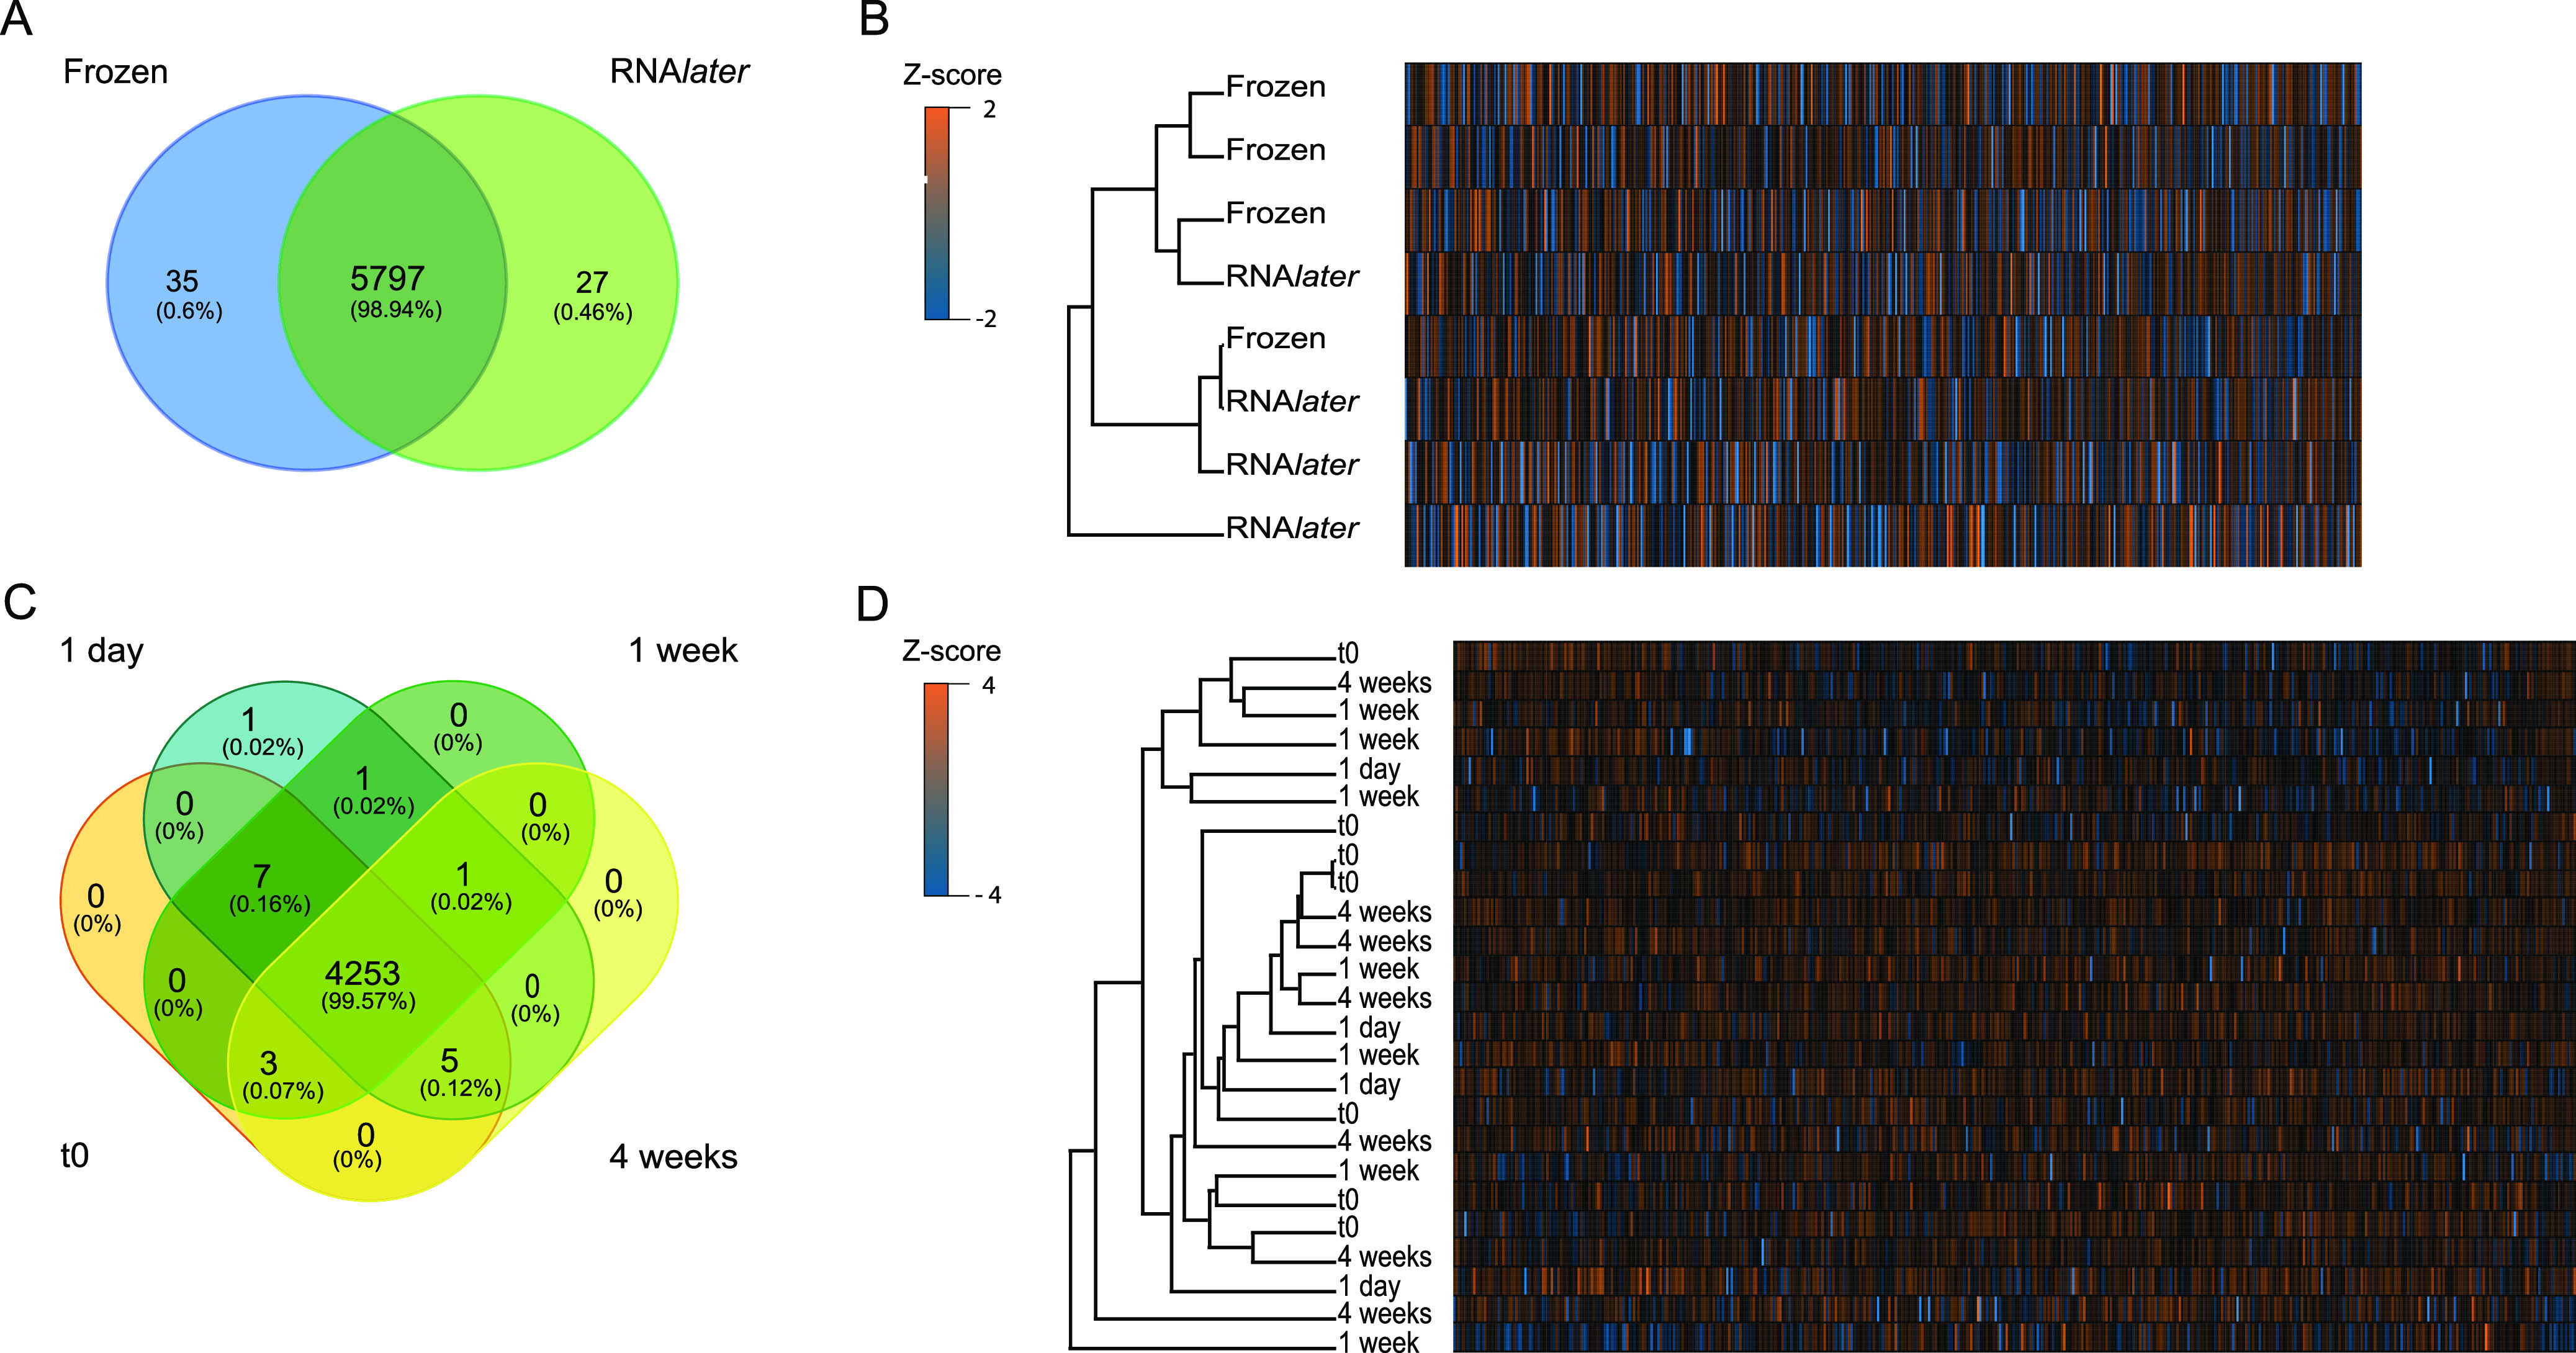
FIG 2.

No systematic bias in protein identification and quantification between preservation methods and storage time points. (A and C) Unique and shared proteins identified in the preservation method comparison (A) and the RNAlater time series (C). Only proteins that were retained after filtering for a 5% FDR and that were detected in at least 75% of samples in at least one group (preservation method/time point) were used for the analysis. (B and D) Hierarchical clustering of samples based on relative protein abundances for the preservation method comparison (B) and the RNAlater time series (D). The same set of prefiltered proteins was used as in panels A and C and log2 transformed. The hierarchical clustering was based on Euclidean distance. Z-score values were calculated for each protein; positive Z-scores indicate a relative abundance higher than the mean, while negative Z-scores indicate a relative abundance lower than the mean.
