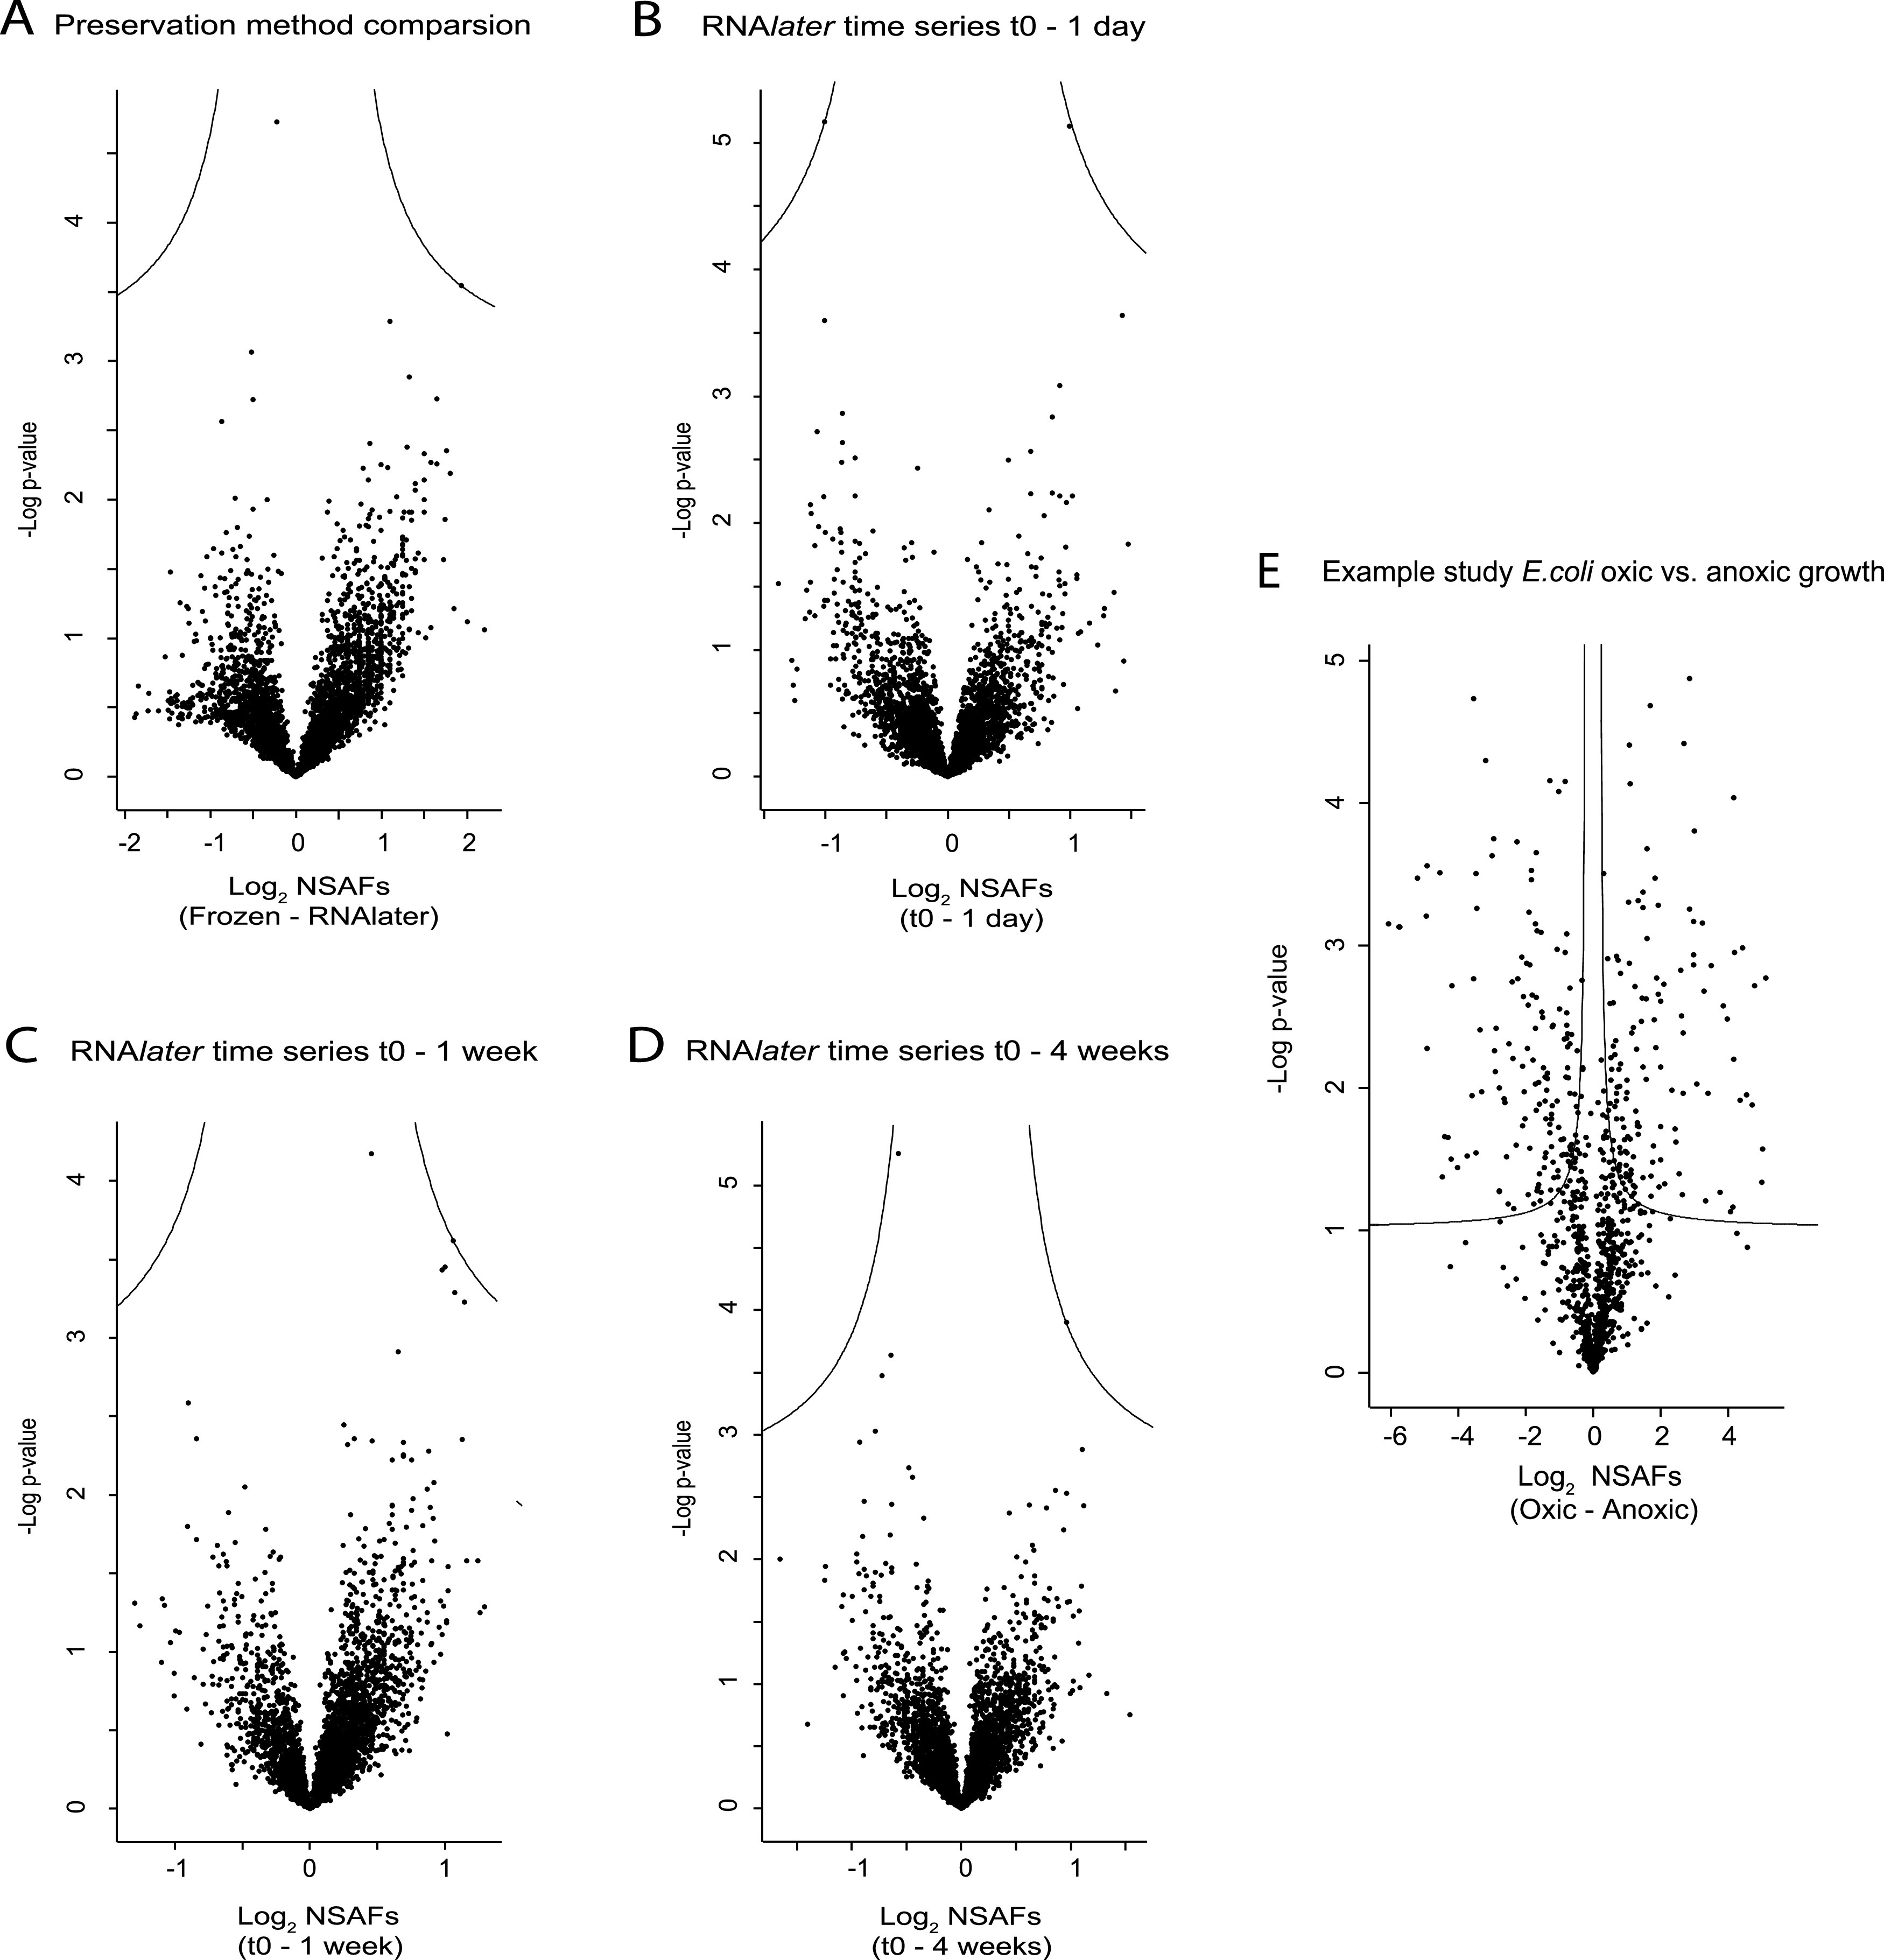
FIG 3.

No differences in protein abundances between preservation methods and storage time points. Volcano plots of proteins filtered for a 5% FDR and at least 75% valid values in at least one group identified in the preservation method comparison (A), the RNAlater time series (B to D), and an example study of E. coli grown under oxic and anoxic conditions (E). All proteins were plotted with log2(fold change) on the x axis and − logP on the y axis. The solid lines represent the significance threshold at 5% FDR and S0 of 0.1. Data points above the line represent proteins whose abundances significantly differed between comparisons, whereas data points below the line represent proteins whose abundances did not significantly differ between comparisons.
