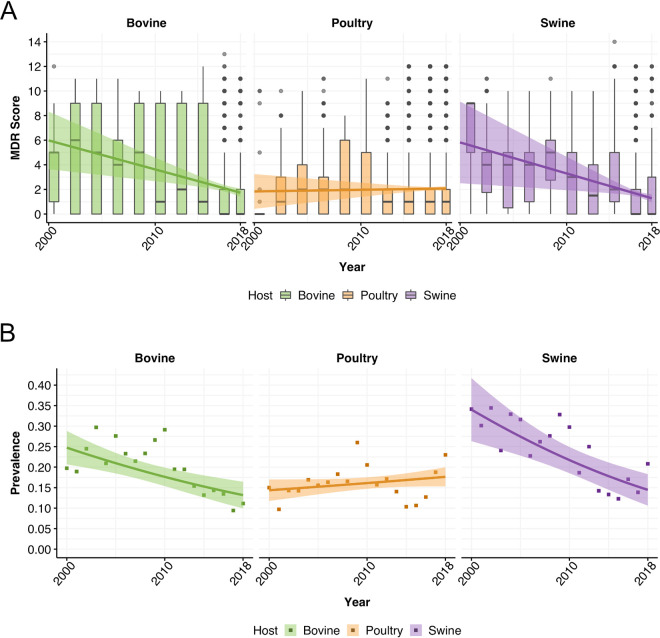
FIG 1.
Temporal trends of multidrug resistance. (A) Temporal trends of the average numbers of antimicrobial classes Salmonella genomes in food animals are resistant to (multidrug resistance [MDR] scores). Solid lines represent the fitted MDR scores obtained from the negative binomial regression, and shading the 95% confidence intervals. (B) Temporal trends of the prevalences of isolates with resistance to ≥3 antimicrobials in NARMS. Solid lines represent the fitted prevalences from quasibinomial regressions, and shading the 95% confidence intervals.

