FIG 6.
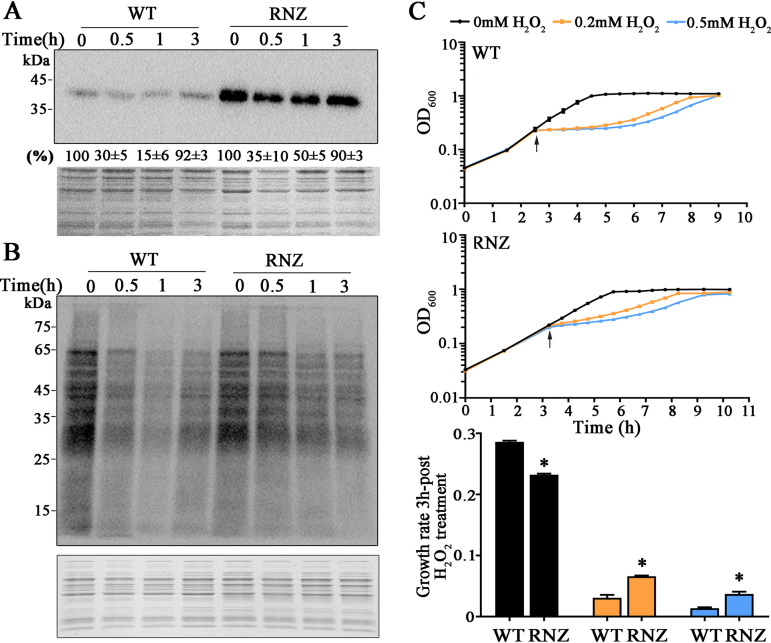
So-RNaseZ overexpression recovers H2O2-suppressed protein synthesis and growth of S. oligofermentans. (A) Western blotting assayed the So-RNaseZ abundances in strains pDL278RNaseZ-6×His (WT) and So-RNaseZover (RNZ). The two strains were cultured anaerobically, and until the mid-exponential phase, 500 μM H2O2 was added. After H2O2 treatment at indicated times, cells were collected and lysed. Same amounts of total cell protein were loaded on two 12% SDS-PAGE gels, and one was examined by Western blotting using anti-His antibody (upper panel), while the other was stained with Coomassie brilliant blue as an indicator of equivalent loading (lower panel). Western blotting signal intensities of the So-RNaseZ protein were measured using Image J and expressed as the percentages of respective strain without H2O2 treatment. Triplicate experiments were performed, and averages ± SD are shown below one representative image. (B) Strains were cultured and H2O2 treated as described in panel A, and puromycin was added 10 min before cell collection. Western blotting assayed puromycin integration using the anti-puromycin antibody (upper panel), and the same amounts of the total protein were run on 12% SDS-PAGE gels that were stained with Coomassie brilliant blue (lower panel). Molecular weight marker is shown for each gel on the left. Triplicate experiments were performed, and representative results are shown. (C) Strains in panel A were grown anaerobically in triplicate to an OD600 of ∼0.2, two replicates were treated with 200 and 500 μM H2O2 (arrows pointed), respectively, and the other remained untreated. The growth of strains WT (top panel) and RNZ (middle panel) was monitored by measuring OD600 at indicated time points. The lowest panel shows the growth rates within 3 h post-H2O2 addition. Experiments were repeated three times on triplicate samples for each measurement, and averages ± SD of one independent experiment are shown. *, significantly different from the WT strain (Student’s t test, P <0.05).

