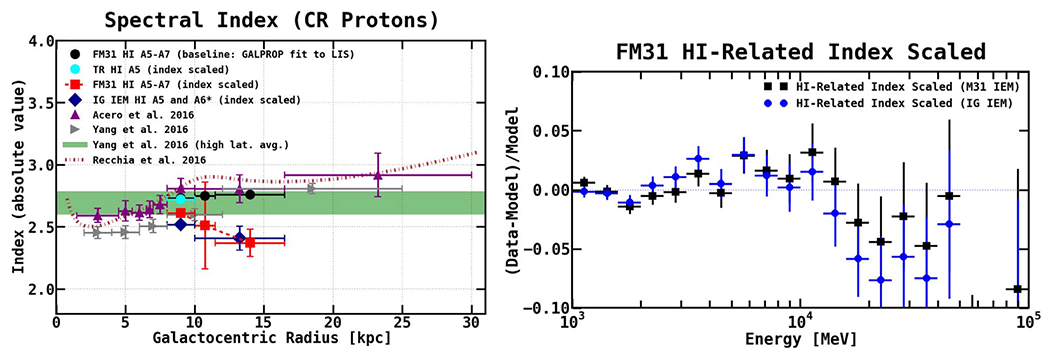
Figure 38.

Left: the index of the H i-related emission as a function of Galactocentric radius. The black circles give the baseline index for the M31 IEM corresponding to the GALPROP prediction (~2.75). The cyan circle is the best-fit index for the local annulus obtained in the TR (using the M31 IEM), which is consistent with the GALPROP prediction. The red squares show the results for scaling the index of the H i-related components in FM31. The middle ring, A6, has the smallest radial extension—and likewise, it has the largest error bars. We also repeat the fit using the IG IEM, which only has one outer ring. The results for the IG IEM are shown with blue diamonds, and they are qualitatively consistent with the M31 IEM. For comparison, we also show other measurements. The purple upward-pointing triangles are from Acero et al. (2016). For the local ring, the fit includes all longitudes and 10° < |b| < 70°; for the outer Galaxy (last two rings), the fit includes all latitudes and 90° < l < 270°. The gray rightward-pointing triangles are from Yang et al. (2016). The fit is performed in the latitude range |b| < 5°. The green dashed band is also from Yang et al. (2016), and it shows the 1σ average photon index (above 2 GeV) in the region 10° < |b| < 15° and 90° < l < 150°, which corresponds to the M31 direction. Last, the brown dashed curve is a model fit from Recchia et al. (2016), which is based on nonlinear CR propagation in which transport is due to scattering and advection off self-generated turbulence. These other studies find evidence for a gradual softening toward the outer Galaxy. There is clearly a significant anomaly in FM31. Right: fractional energy residuals resulting from scaling the index of the H i-related components, for both the M31 IEM and the IG IEM.
