
Figure 47.
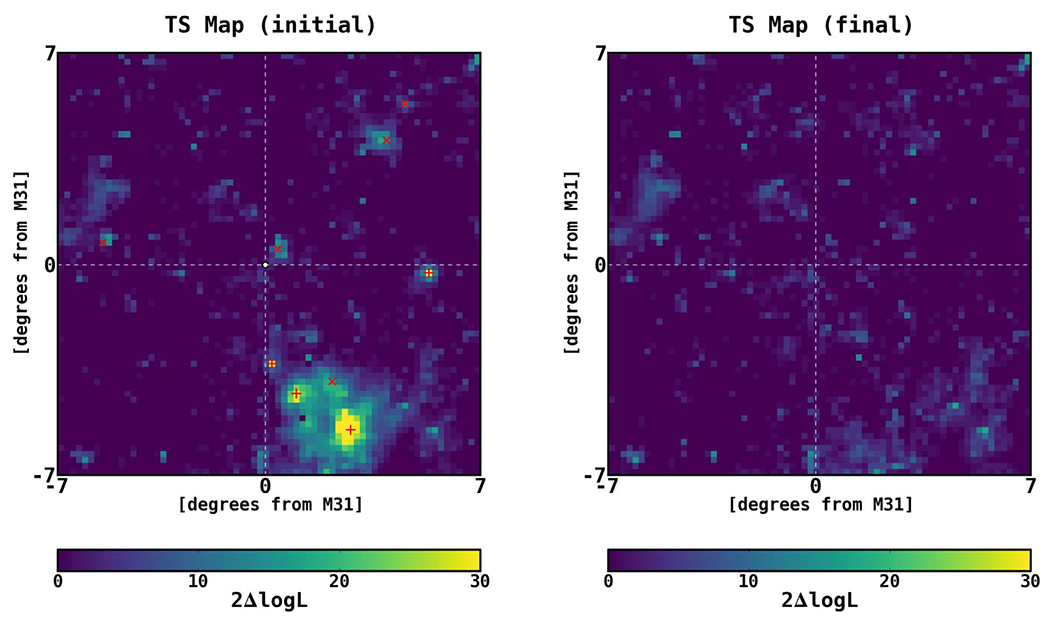
TS map before and after the additional point sources are included in the model. Note that M31 is modeled with an elliptical template based on the IRIS 100 μm map of the galaxy The region shown is a 14° × 14° square, centered at M31 (white circle). The color scale corresponds to the TS value (2Δ log L), as calculated by gttsmap. Overlaid on the initial TS map are the positions of the additional point sources that we find with procedure. Point sources with TS ⩾ 25 are shown as red crosses, and sources with 9 ⩽ TS < 25 are shown as angled red crosses.