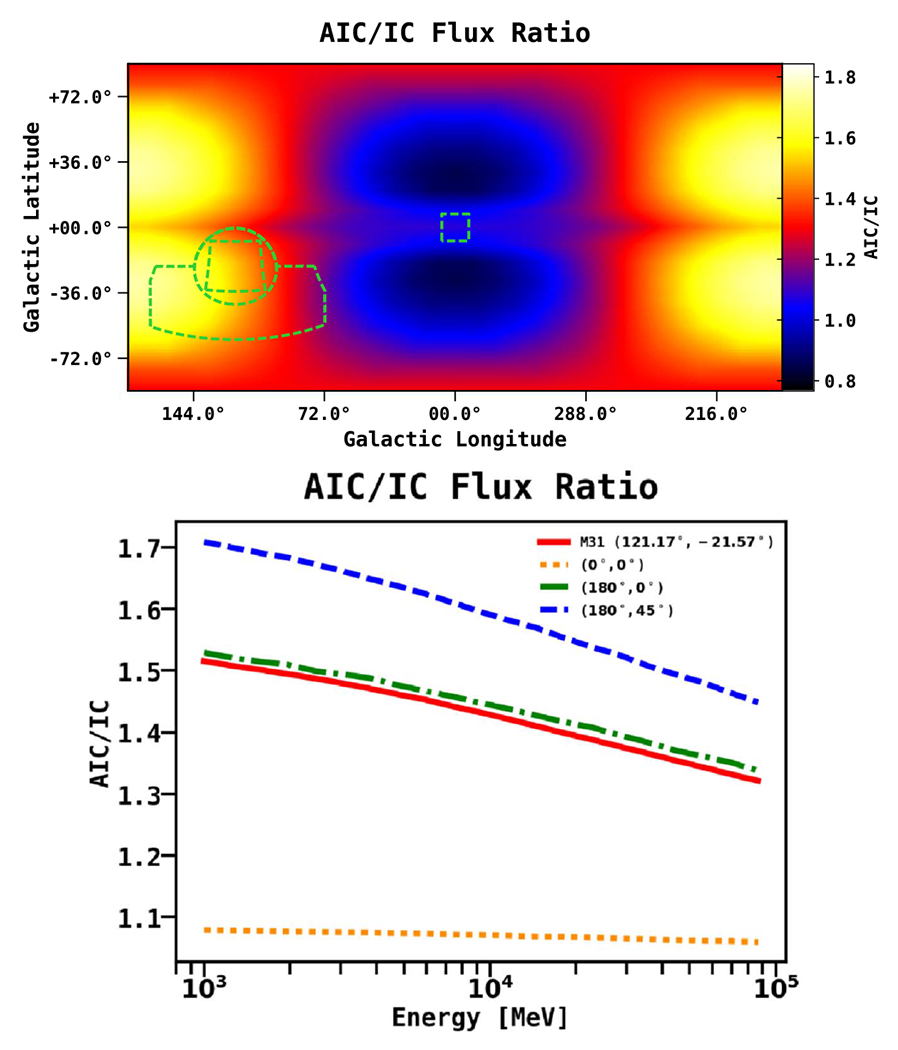
Figure 7.

The IEM employs the anisotropic IC sky maps, as discussed in the text. For comparison, we show the differential flux ratio (AIC/IC) between the anisotropic (AIC) and isotropic (IC) inverse Compton components (all-sky). The top figure shows the spatial variation of the ratio at 1 GeV. The bottom figure shows the energy dependence of the ratio for four different spatial points, including M31. The ratio is close to unity toward the GC, increases with Galactic longitude and latitude, and reaches maximum at midlatitudes toward the outer Galaxy. Note that we use the anisotropic IC maps as our default component. Unless otherwise stated, all reference to the IC component implies the anisotropic formalism.
