
Figure 1.
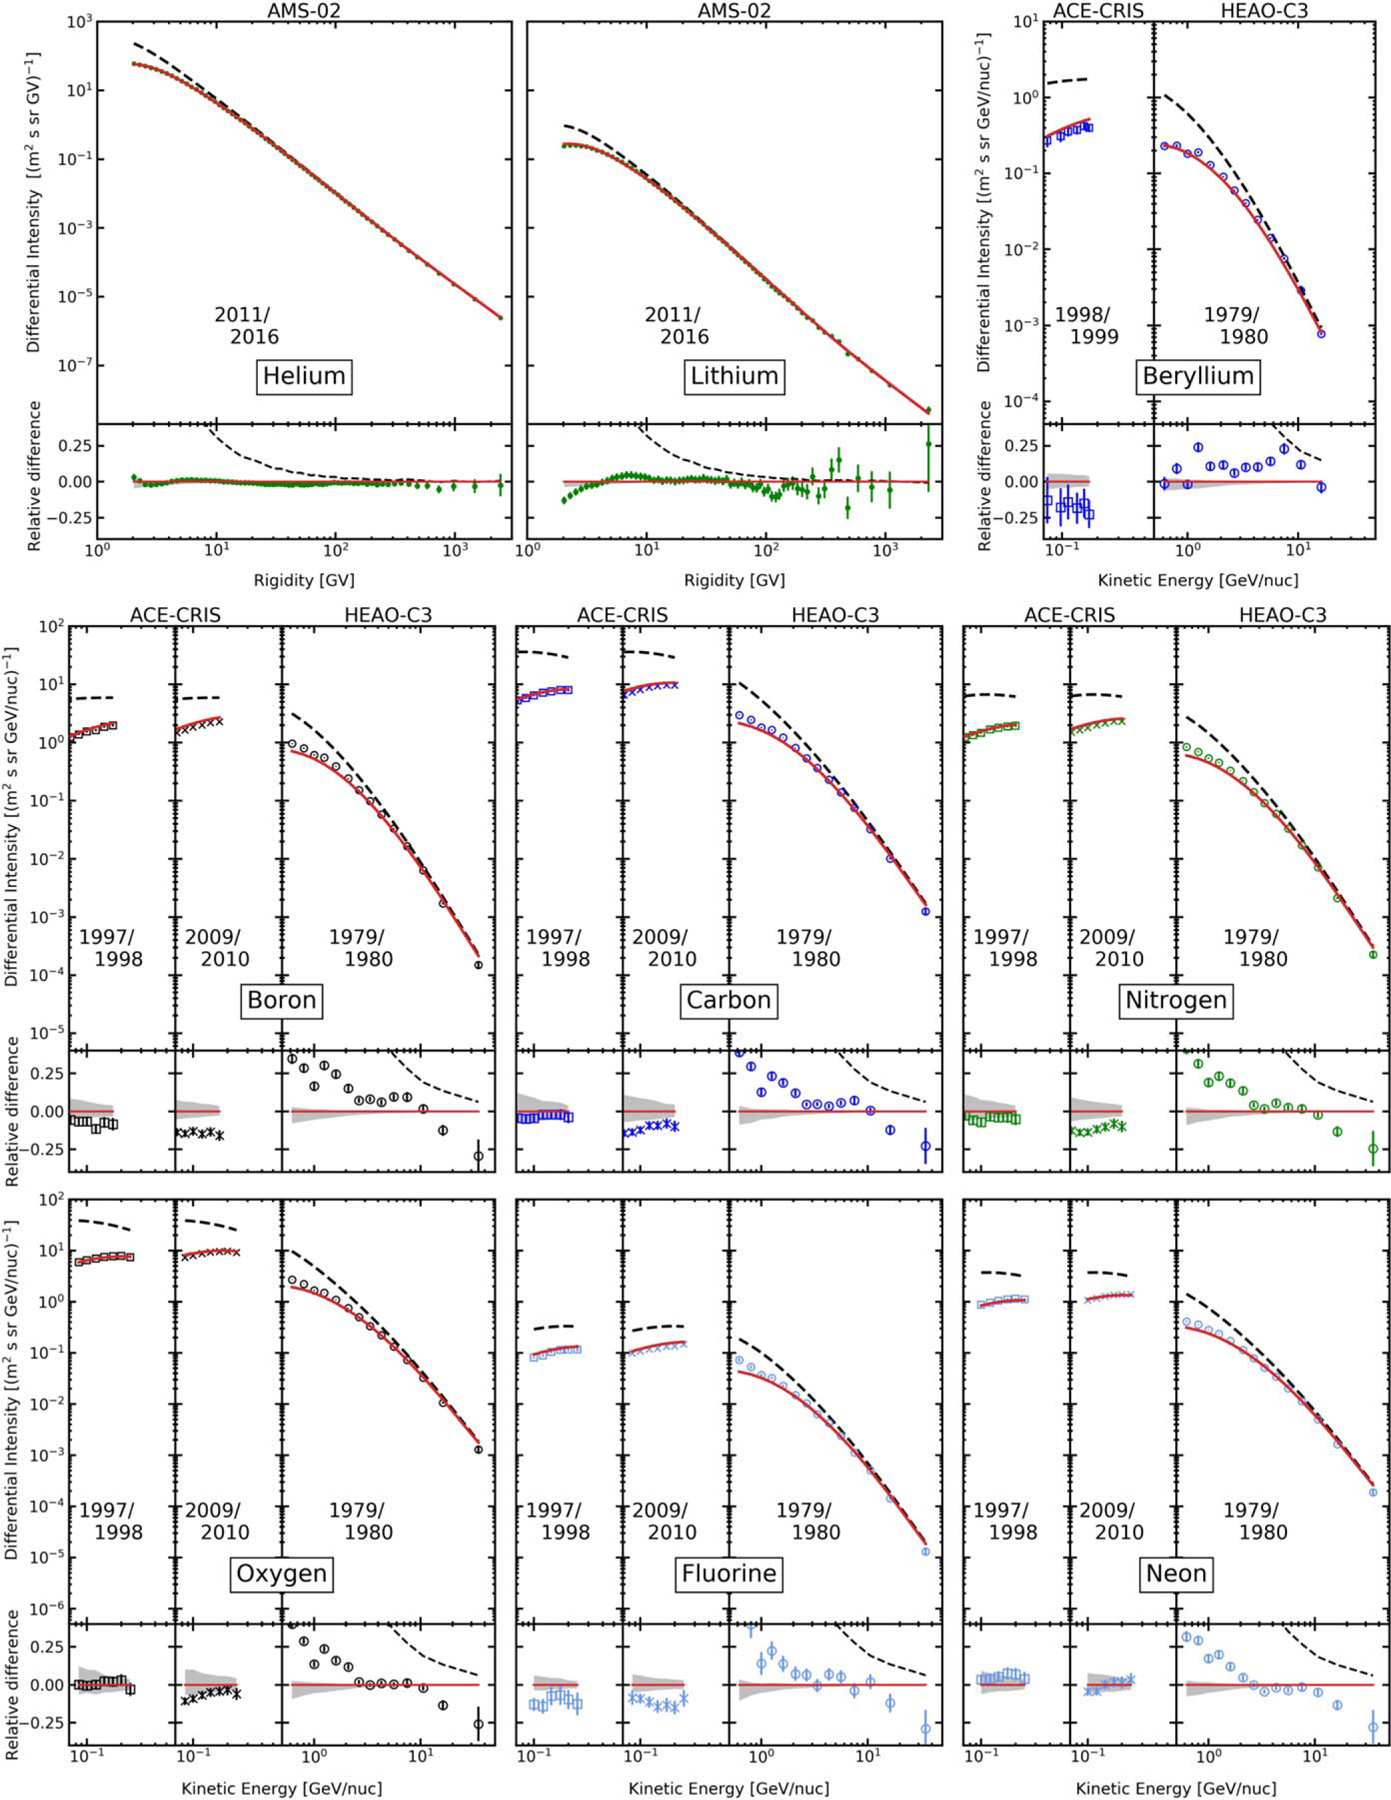
Calculated elemental spectra: 2He–10Ne. Black dashed lines show the calculated LIS spectra; the red solid lines are modulated to the levels that correspond to the periods of data taking. Data for Z ⩾ 4: ACE-CRIS and HEAO-3-C2 (Engelmann et al. 1990). AMS-02 data for 2He and 3Li are compared to the I-scenario calculations; see Section 3.2 for details. Bottom panels in each plot show the relative difference between the calculations and a corresponding data set.