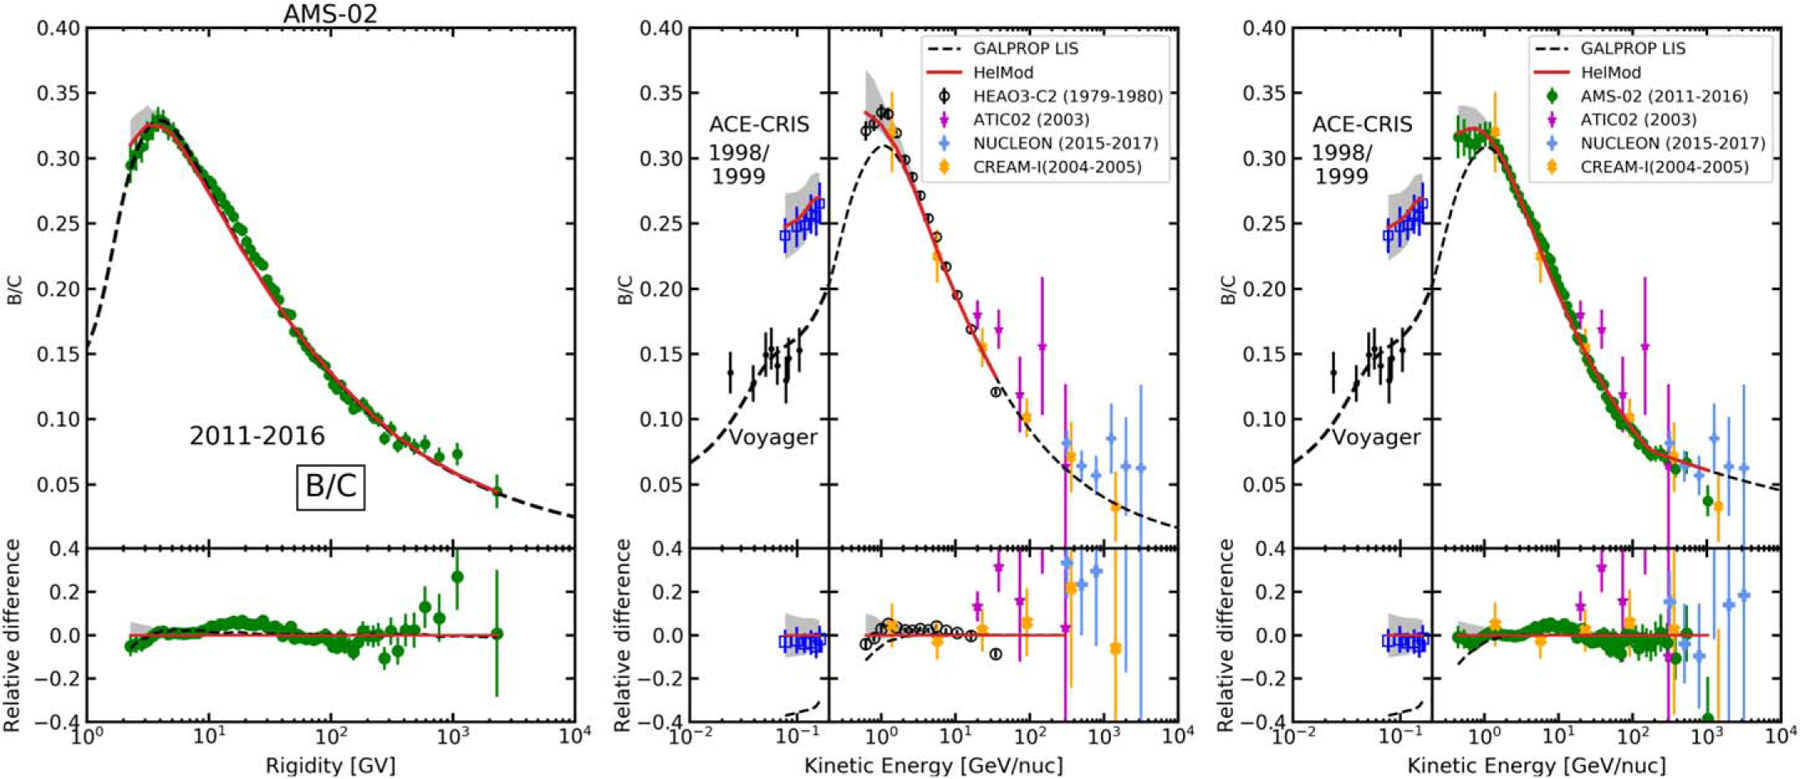
Figure 4.

B/C ratio calculated for the I-scenario compared to AMS-02 (left; Aguilar et al. 2018c) and HEAO-3-C2 (middle; Engelmann et al. 1990) data. The right panel shows a comparison of the B/C ratio calculated for the P-scenario with available measurements, where HEAO-3-C2 data are not shown for clarity. In the middle and right panels the measurements by Voyager 1 (Cummings et al. 2016), ACE-CRIS (1998–1999), ATIC-2 (Panov et al. 2009), CREAM (Ahn et al. 2008, 2009), and NUCLEON (Grebenyuk et al. 2019b) are shown. Note that the units in the left panel are rigidity, while the middle and right panels are shown vs. Ekin per nucleon. Line coding is the same as in Figure 1.
