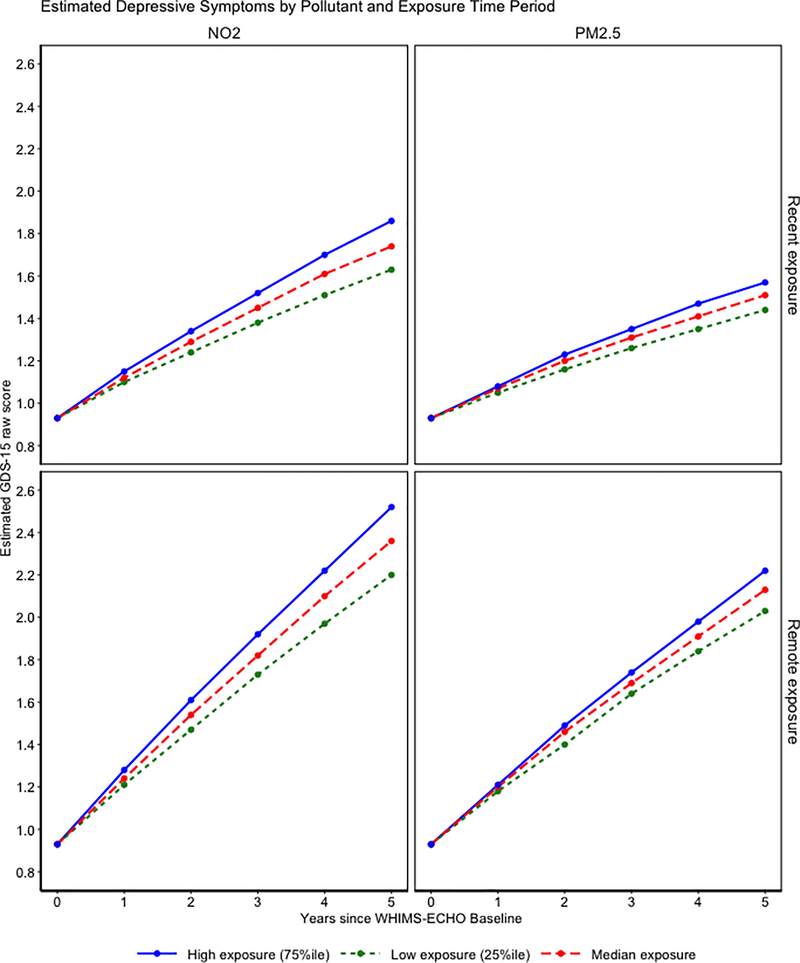
Figure 2.
Estimated depressive symptoms as measured by the 15-item Geriatric Depression Scale by pollutants and exposure time period for low (25th percentile), median, and high (75th percentile) average 3-year exposure. The exposure effects are portrayed in a grid with the first row representing recent exposure and the second row representing remote exposure. The first column represents the NO2 exposure effect while the second column is the PM2.5 exposure effect. Therefore, the graph illustrated in the first row and first column represents the effect of recent NO2 exposure.
* Denotes p <.05
** Denotes p<.01

