. 2021 Sep 24;12(41):13958–13971. doi: 10.1039/d1sc03472c

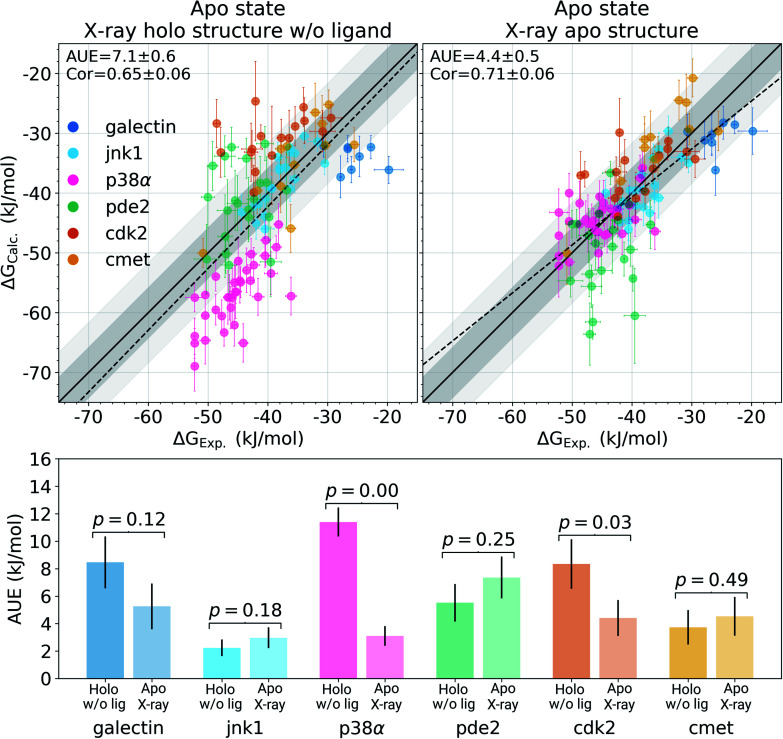
Fig. 2. Experimental binding ΔG values plotted against the calculated estimates. In the panel on the left, the simulations in the apo state were started from the experimental holo structure after removing the ligand. In the panel on the right, the alchemical simulations of the protein in its apo state were initialized with the experimentally resolved apo structure. The starting structure has a marked effect on the calculated ΔG accuracy. The bottom panel shows a break up of the accuracies by protein system. Probability values measure the significance of the difference between apo and holo absolute unsigned errors via a Welch's t-test. Dark and light shaded areas represent regions deviating from experiment by at most 1 and 2 kcal mol−1.

Fig. 2