. 2021 Sep 6;12(41):13686–13703. doi: 10.1039/d1sc03628a

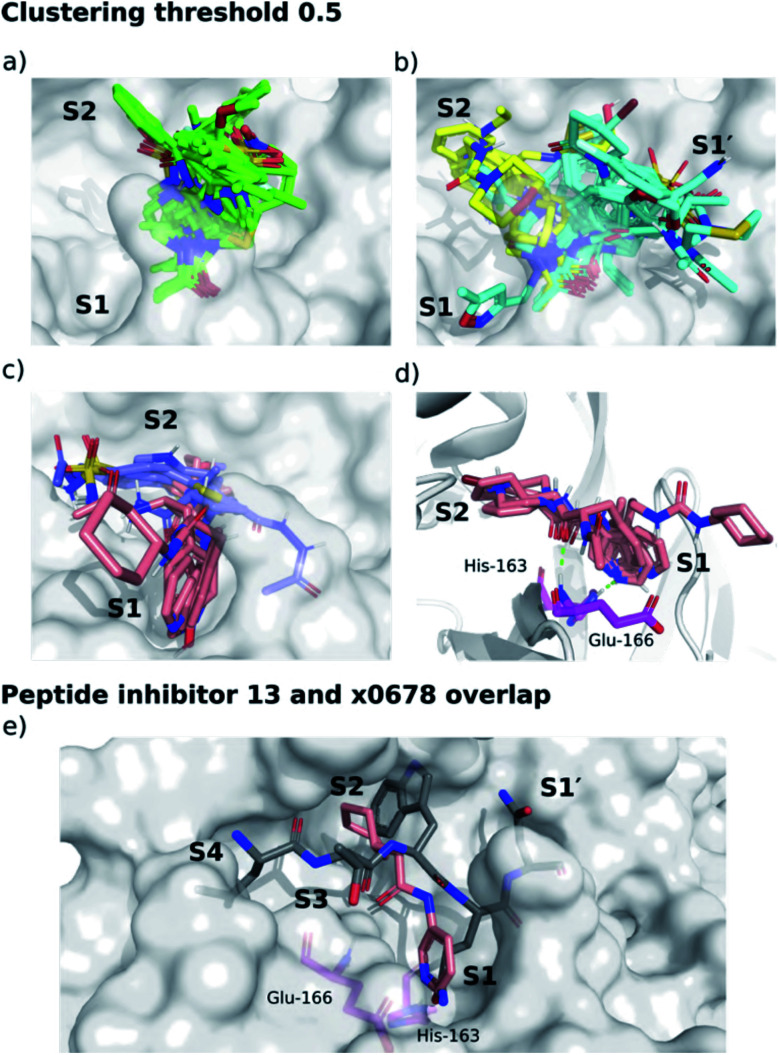
Fig. 14. Clustering of XChem active site-binding fragments. Surface of the x0830-bound Mpro structure (white surface) and the top 5 most populated fragment clusters using a clustering threshold of 0.5. (a) Cluster 1 fragments tend to occupy S1′ (green); (b) clusters 2 (cyan) and 3 (yellow) tend to span S1′ and S2; (c) clusters 4 (lilac) and 5 (pink) tend to occupy S2 and S1. (d) Close-up of cluster 5. Green dotted lines indicate the two key HBs between the fragment carbonyl oxygen and the backbone nitrogen of Glu-166 (HB 3, Fig. 3), and between the His-163 Nε and the heterocyclic nitrogen of the fragment (HB 6, Fig. 3). (e) Overlay of the P4–P1′-truncated structure of peptide inhibitor p13 (grey) from an MD snapshot and cluster 5 binder x0678 (pink), with the x0678 co-crystal structure (white surface).

Fig. 14