. 2021 Sep 6;12(41):13686–13703. doi: 10.1039/d1sc03628a

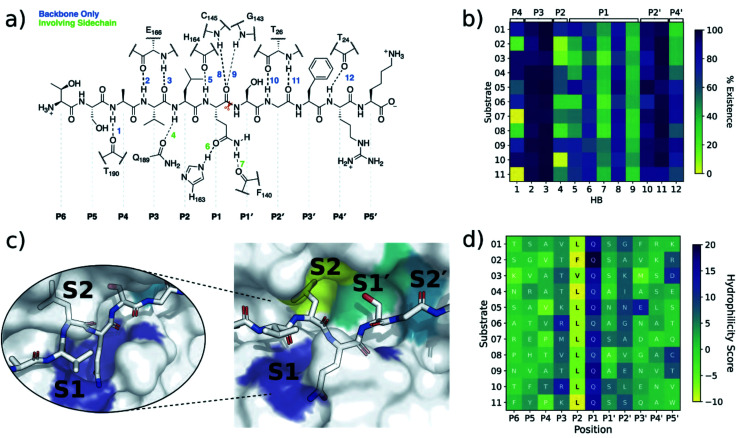
Fig. 3. Interactions between SARS-CoV-2 Mpro and its substrates. (a) Mpro–substrate hydrogen bonds (HBs) exemplified by substrate s01. (b) An annotated heat-map showing the frequency of each HB, with blue indicating highest frequency. Frames were extracted every ns from 600 ns of cumulative explicit-solvent MD conducted per system. (c) Close-up of the MD-generated binding mode of SARS-CoV-2 Mpro-substrate s01 with subsites S1, S2, S1′ and S2′ labelled. Different views of the S1 subsite are shown, emphasizing the deep S1 pocket that accommodates the P1 Gln sidechain. Subsite surface colour corresponds to the hydrophilicity score, with hydrophobic subsites shown in yellow, hydrophilic subsites in dark blue, and amphiphilic subsites in turquoise. (d) Hydrophilicity map for the 11 substrates calculated as the sum of hydrophilic interactions (dark blue) subtracted from the sum of hydrophobic interactions (yellow). Interactions were identified from substrate:Mpro frames using Arpeggio45 (Methods Section S1.5).

Fig. 3