. 2021 Sep 6;12(41):13686–13703. doi: 10.1039/d1sc03628a

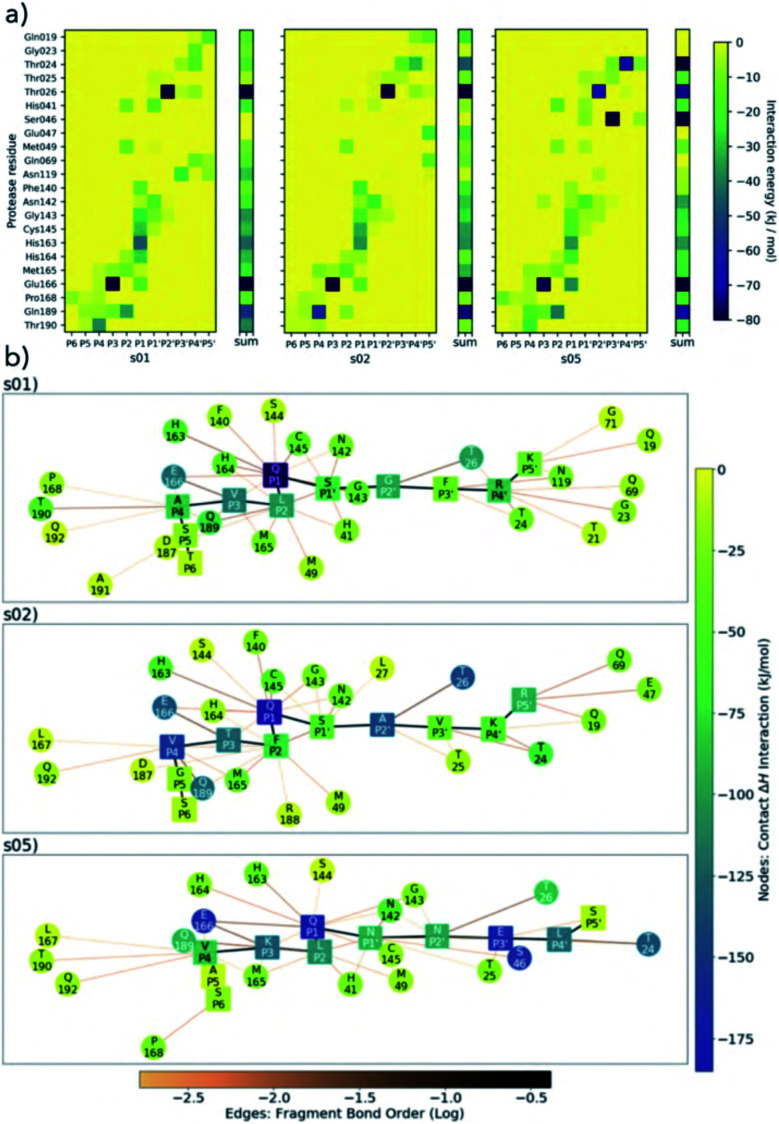
Fig. 5. BigDFT analysis of Mpro–substrate interactions. (a) Heatmaps showing QM interaction energies between 22 selected residues of Mpro and s01, s02 and s05. (b) QM interaction networks where node colour indicates interaction strength, from dark blue (strongest) through green to yellow (weakest). Square nodes denote substrate, while circular ones denote Mpro. The thickness and colour of the edges show the fragment bond order between residues, a unitless measure associated with bond strength and analogous to bond order; black is strongest, orange is weakest.51 Interaction energies and bond orders were computed using BigDFT and ensemble-averaged results of MD snapshots.

Fig. 5