. 2021 Sep 6;12(41):13686–13703. doi: 10.1039/d1sc03628a

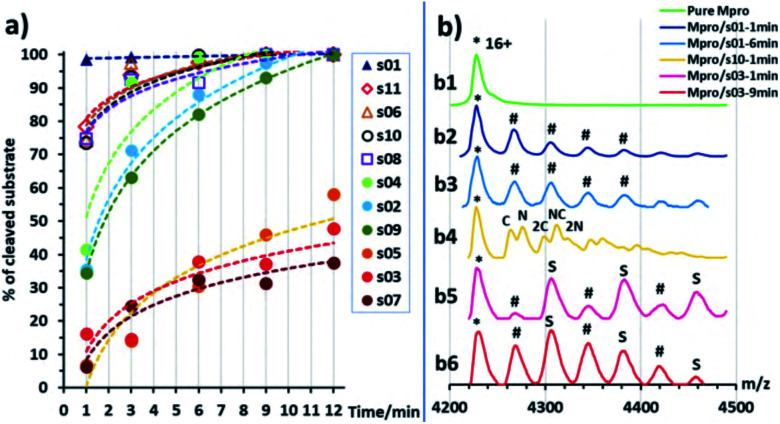
Fig. 7. Non-denaturing mass spectrometry of Mpro substrate turnover. (a) Substrate turnover versus incubation time as measured by non-denaturing MS. Trend lines are given for visual guidance only. (b) Examples of mass spectra showing normalized intensity in the m/z region around the 16+ charge state of Mpro dimer (asterisk, *): (b1) pure Mpro solution (5 μM); (b2) Mpro and s01 solution after 1 min incubation, hashes (#) indicate the mass peaks corresponding to the s01 cleaved fragments sequentially attached to the Mpro dimer; note: the resolution is not sufficient to distinguish between the N- or C-terminal fragments (mass shifts of 617 and 593 Da, respectively); (b3) same solution as (b2) after 6 min incubation; (b4) Mpro and s10 solution after 1 min incubation, ‘N’ labels N-terminal fragment(s) attached (765 Da), ‘C’ labels C-terminal fragment(s) attached (560 Da); (b5) Mpro and s03 solution after 3 min incubation, ‘S’ labels intact substrate(s) attached, hashes (#) label attached substrate fragments, but the N- and C-terminal fragments cannot be distinguished (mass shift 644 and 566 Da, respectively); (b6) same solution as (b5) after 9 min incubation.

Fig. 7