
FIGURE 1.
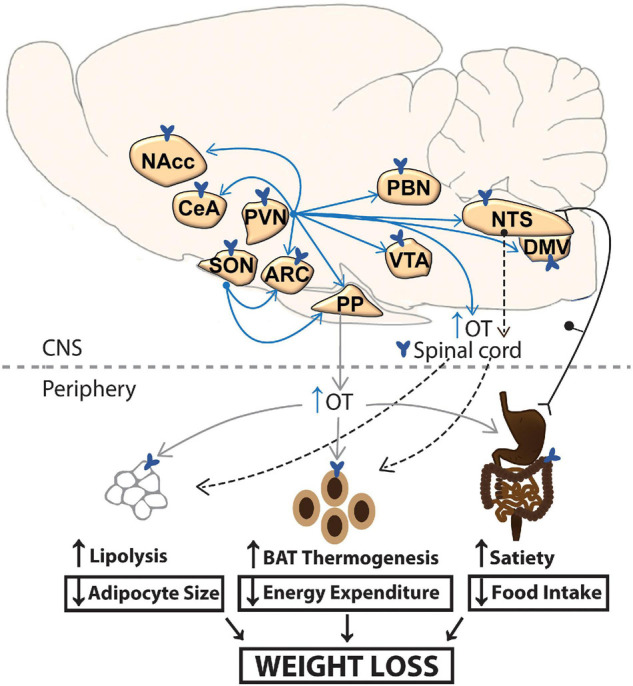
A schematic of circuitry that potentially contributes to the effectiveness of CNS OT on energy homeostasis. OT release within the CNS and spinal cord (shown in blue arrows) or periphery (shown in gray) may impact metabolic processes that result in the reduction of body weight. Dotted arrow represents implicated pathways from NTS to spinal cord and from sympathetic preganglionic neurons in the spinal cord to BAT and WAT. ARC, arcuate nucleus; BAT, brown adipose tissue; CeA, central nucleus of the amygdala; DMV, dorsal nucleus of the vagus; NaCC, nucleus accumbens; NTS, nucleus of the solitary tract; OT, oxytocin; PBN, parabrachial nucleus; PP, posterior pituitary; PVN, paraventricular nucleus; SON, supraoptic nucleus; VTA, ventral tegmental area; WAT, white adipose tissue.