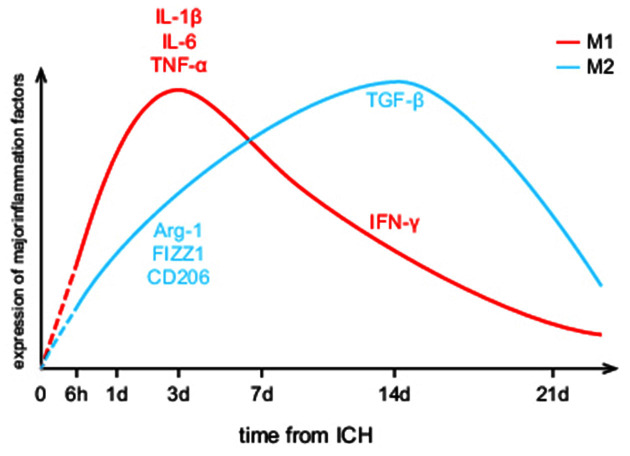
Figure 1.
Dynamic changes of M1/M2 microglial activation levels after intracerebral hemorrhage (ICH). It provides a visual expression that M1/M2 microglia take on different activation characteristics. The red curve represents M1 microglia while the blue curve represents M2 microglia. Yet, the referenced researches about microglial spatiotemporal features are all animal experiments, leaving the human brain as an unknown area.

