
Figure 2.
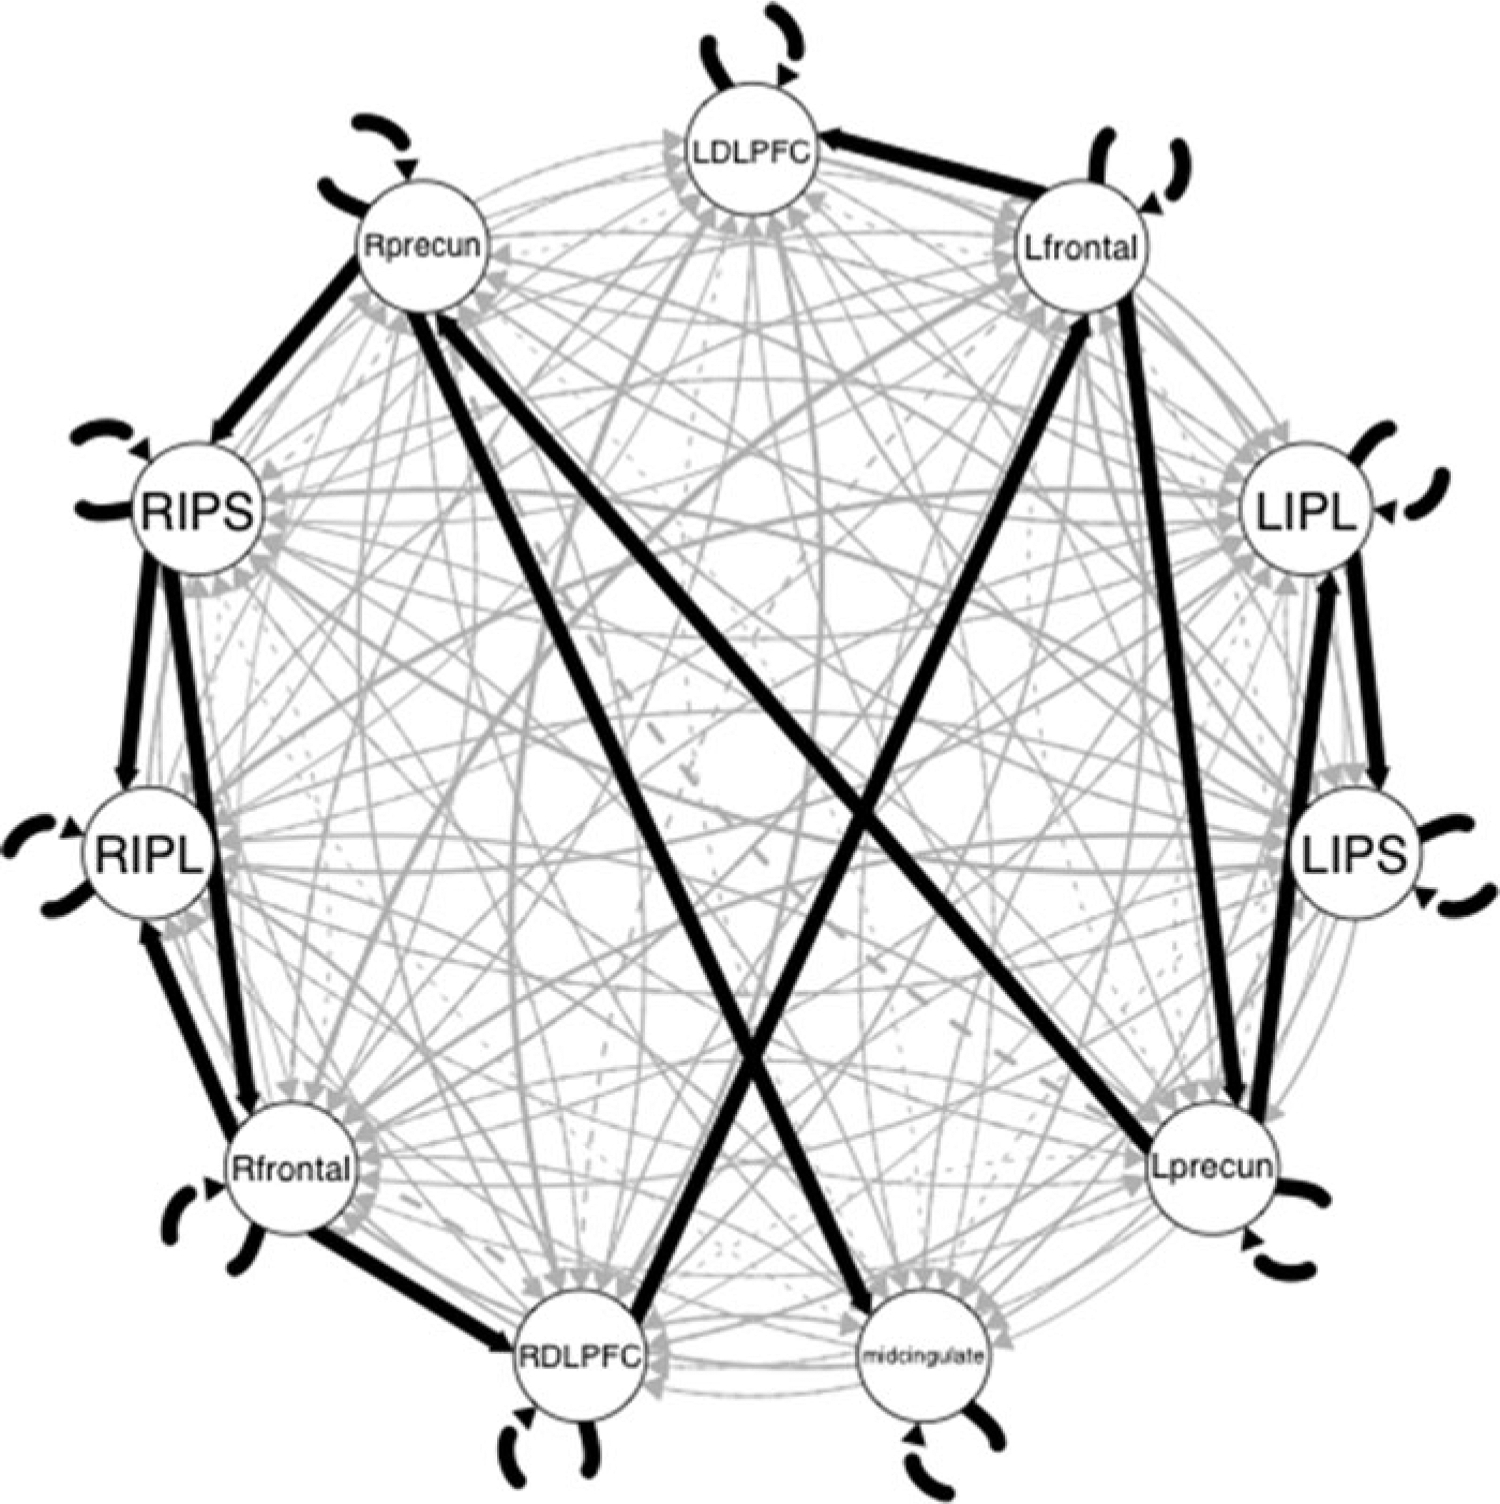
Original GIMME results obtained from the empirical example. Black lines indicate group-level effects; gray lines indicate individual-level effects. Line width corresponds to proportion of individuals having the effect. Dashed lines are lagged; solid lines are contemporaneous relations.