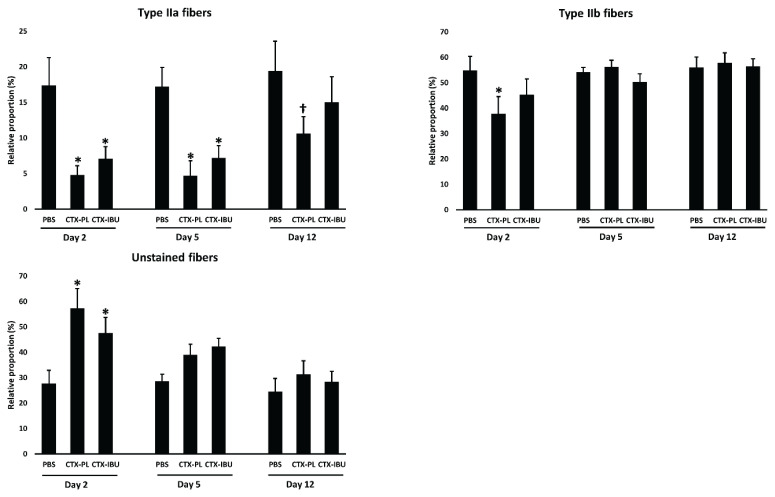
Fig. 3.
Data are presented as average ± SEM for the relative contribution (as % of total fibers) of type IIa, type IIb and unstained (type IIx + immature) fibers of the muscle cross-section. PBS: healthy controls (PBS-injected), CTX-PL: CTX-injected and untreated, CTX-IBU: CTX-injected and ibuprofen-treated. * p<0.05; † p=0.05–0.1.

