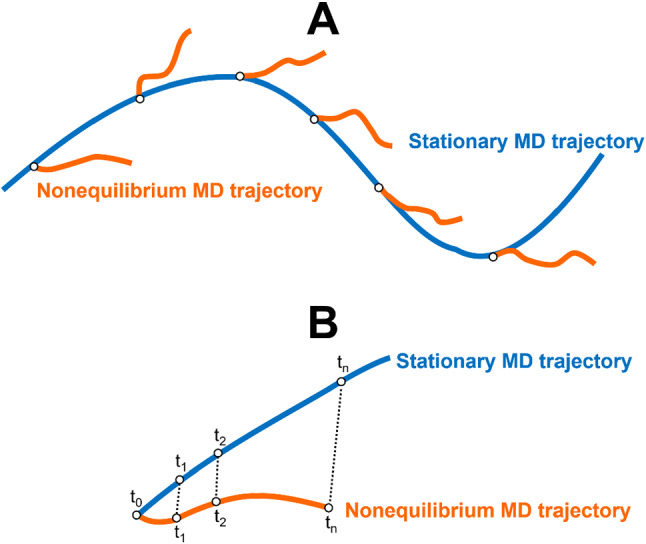
Fig. 1.

A Schematic representation of the D-NEMD approach. The stationary (e.g., equilibrium) MD trajectory (blue line) provides the initial distribution for the nonequilibrium simulations at time t0 (orange lines). The individual nonequilibrium trajectories sample the dynamic evolution of the system after the introduction of a perturbation. B Scheme for extracting the structural response of a protein to a perturbation. For each pair of stationary and nonequilibrium trajectories, the system’s response to the perturbation is obtained by comparing the position of each individual C atom in both trajectories at equivalent points in time. The statistical average of the response as a function of the time is then determined, and the corresponding statistical errors calculated
