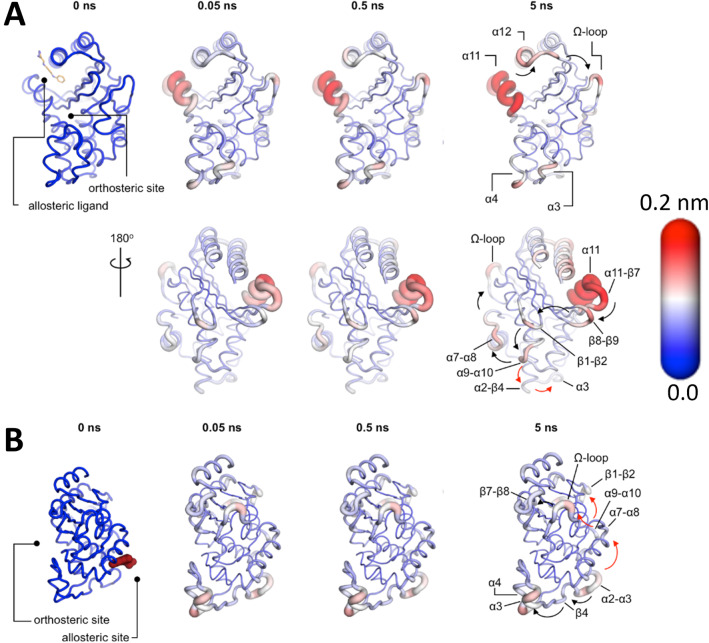
Fig. 9.
D-NEMD simulation pathways reveal communication pathways in TEM-1 (A) and KPC-2 (B) class A -lactamase enzymes, showing how changes in binding at an allosteric site (distant from the active site) are transmitted to the enzyme active site. The amplitude of the C structural response to the removal of an allosteric ligand is coloured according to the scale on the right. The cartoon thickness is also related to the amplitude of the conformational response. The arrows mark the direction of the propagation of the signal upon the removal of the allosteric ligand. The red and the black arrows highlight different routes for the signal to propagate. This image was adapted from reference [36]

