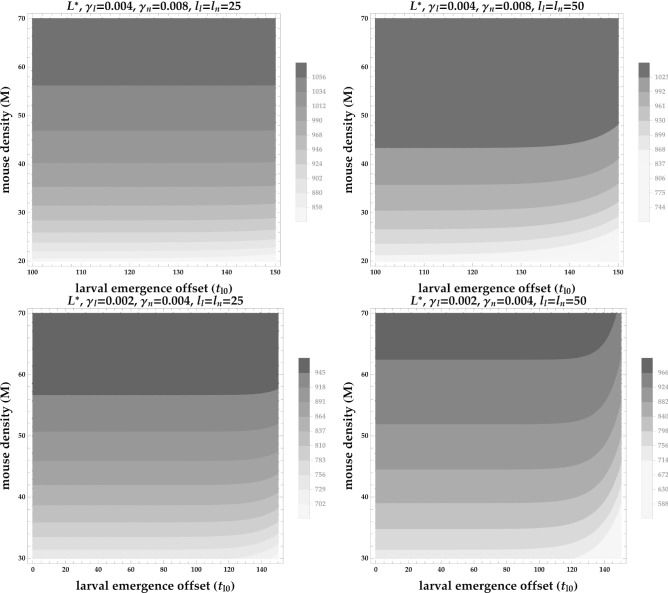
Fig. 7.
Equilibrium larval population sizes () decrease at low mouse densities when larval activity begins much later than nymphal activity. is the mouse population size, is the offset between when nymphs and larvae begin emerging, and are the contact rates between larvae and mice and nymphs and mice, respectively. The first row shows that if and are high, large decreases slightly when nymphal and larval emergence is broad ( and ). The second row shows that if and are low, large decreases more strongly, especially when nymphal and larval emergence is broad ( and ). Note that contour colors are not the same across plots. All other parameter values are shown in Table 1

