
Fig. 32.
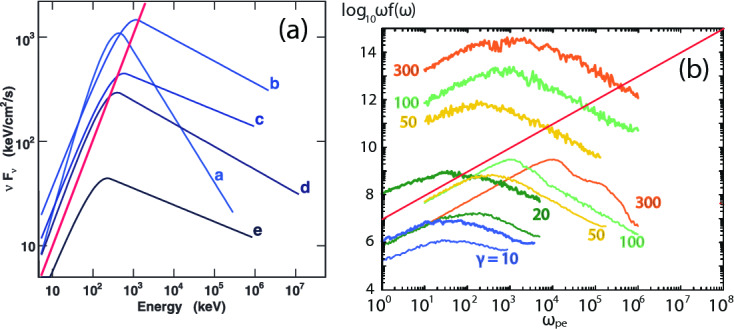
Comparison of synthetic spectra (b) with Fermi observations for GRB 080916C (a). a Modeled Fermi spectra in units at five different times. A flat spectrum would indicate equal energy per decade in photon energy. The changing shapes show the evolution of the spectrum over time. b PIC generated spectra for jet Lorentz factors of , and 300. For each case two simulations are represented by the same color for cold (thin, lower lines) and warm (thick, upper lines) jet electrons. The low frequency slope is approximately 1.
Image reproduced from Nishikawa et al. (2012); copyright by the authors