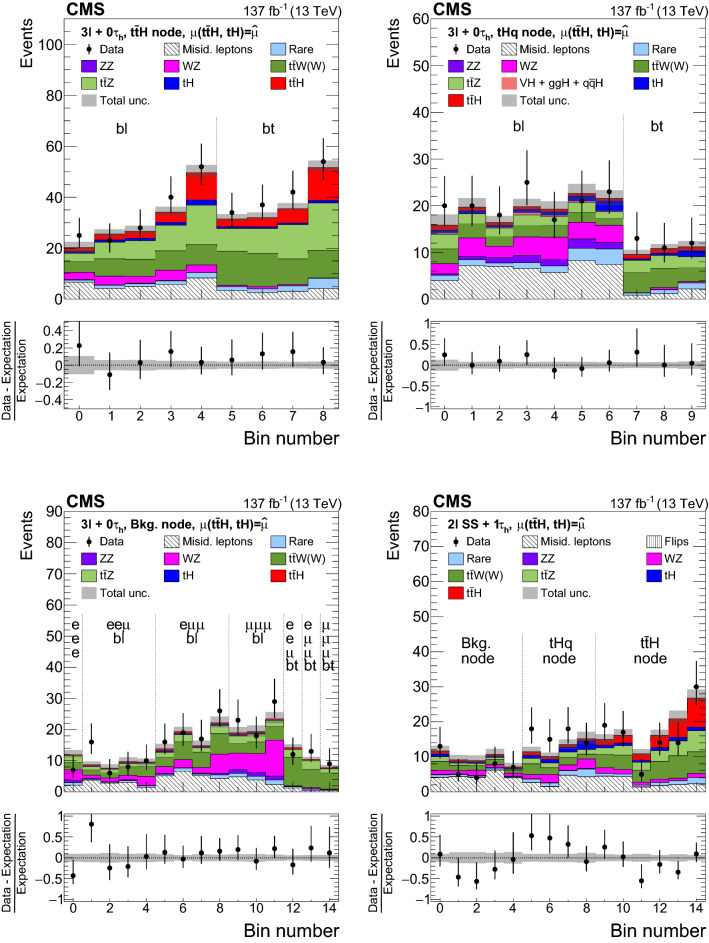
Fig. 9.
Distributions of the activation value of the ANN output node with the highest activation value for events selected in the channel and classified as signal (upper left), signal (upper right), and background (lower left), and for events selected in the channel (lower right). In case of the channel, the activation value of the ANN output nodes for signal, signal, and background are shown together in a single histogram, concatenating histogram bins as appropriate and enumerating the bins by a monotonously increasing number. The distributions expected for the and signals and for background processes are shown for the values of the parameters of interest and of the nuisance parameters obtained from the ML fit. The best fit value of the and production rates amounts to and times the rates expected in the SM

